Silver: Will it be Up or Down?
After the May 1 take down, silver has been trading in an increasingly narrow range. A price breakout is expected, especially with so many potential triggers in the horizon - end of QE2 & the ongoing Euro zone crisis being high on the list.
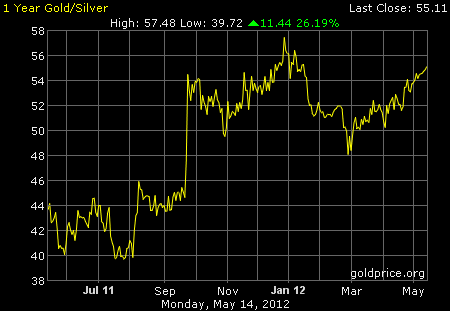
So, will it be going North or South? Another steep correction down or another shot at the $50 near term target?
Rich (Live from ‘The Bridge of the Silver Rocket Ship’) thinks it’s UP, and here’s why..
-
Calling all ‘Rocketiers of the Happy Silver Ship’
I implore all those still nervous about getting onto this silver rocket to take a long hard look at the following graph.
It should be noted, this is not research you’ll find handed out from some Goldman freebie or MoneyWeek special. This has been put together here at the Scarborough Bullion Desk from hours of collating specific data. I don’t labour the point of it’s exclusive merit for some long sought ego trip, but only to highlight that I am very confident that this is analysis that is largely ‘off the radar’ of most of the silver trading block, whether individual, professional, or otherwise.
And more importantly what it shows to me, is that contrary to the nervous mainstream commentary now sweeping into the silver investing community, the internal structure for silver investors has hardly ever looked brighter.
The graph below charts the Silver Price (blue) against the Commercials Net Short to Long Position (red) on the US Comex Futures Exchange.
As a brief way of background: There are 3 main groups of investors who trade the futures exchanges. The Small Speculators (you and me), the Large Speculators (hedge funds, investment houses and the like) and the Commercials.
The Commercials are the big ‘bully’ players, the bullion banks et al, who to a large degree ‘own’ the exchanges, sit on the clearing house boards, enjoy the privilege of first hand/‘inside’ information and as such more often than not maul the rest of the speculative community who dare to trade on their patch.
Traditionally they act as agents for producers/refiners/consumers such as mining companies etc. who might be looking to hedge/forward sell their wares into the market place. They benefit from size, control of ‘the bridge’, steerage of the regulators and depth/speed of knowledge across the whole of the sector. Where the Casino can be argued to be weighted in the House’s favour, I think it only reasonable to suggest the Futures Exchanges are rigged to the Commercials advantage.
Anyway enough of the rant, the point on this occasion I’m really trying to make is that it is clearly very relevant for anyone playing in the ‘silver pits’ to take suitable account of what these ‘insiders’ are up to and how they are positioned. As it is only reasonable to expect that their actions will have a bearing on the direction of prices going forward.
Back to the graph below
Comparing Silver Price with (Commercial Net Short)/ (Total Long) Ratio
The blue line shows the performance of the price of silver since early 2005 (taken from the London Silver Fix).
The red line shows the ratio of the Commercials net short/long position (i.e. how many short contracts the Commercials hold collectively against their total number of long contracts). While the Commercials have always been net short throughout this whole bull cycle (a likely product of their hedging services), they have on occasion reduced their net short position down considerably, indicating that their determination that the market price has become better value or the likelihood of higher prices ahead. On very rare occasions this ratio has slipped for a week or two below the ‘Magic Number’ 2, a level we have presently been below for the last 3 weeks.
As the graph clearly depicts on every other occasion the ratio has sunk below this ‘Magic 2’ level, it has always coincided with a suitable medium/longer term buy opportunity for any investors keen to back up the truck. On 3 of the previous 4 occasions, the price of silver has bottomed almost immediately and then rebounded higher by some 50-100% in less than 12 months. The only other occasion where the price of silver continued to fall in the very short term, was during the quite extra-ordinary financial crisis in October/November 2008, where the price continued to slip (as did the ratio) for a number of weeks, before an eventual bottom was made. However even on this occasion of quite extra-ordinary financial stress the ratio below 2 was signalling to all medium/longer term investors that this was an ideal buy opportunity and needless to say less than 3 years later anyone who had heeded that signal would have seen returns of some 500%!
In summary
Contrary to general market sentiment at present, this graph is sending out a multi-month buy opportunity for all silver investors. Historically this ‘Magic 2’ analysis has pointed consistently to 50% plus returns within a 9-12 month time frame. Almost every occasion has signalled an imminent bottom, with the exception of the fall of 2008 which taught us all that under the most extreme set of conditions (remember the entire Western Banking System was on the cusp of collapse!) a market can behave irrationally for a period of time. However the ‘Magic 2’ buy signal was as relevant during October 2008 as at any other time in this Bull Cycle and anyone who had taken it’s cue would have bought their metal at the most opportune period within the last 5 years!
This graph, backs up my previous expectations that the price of silver is presently bottoming out in the mid 30’s, and indicates that the ‘beach ball’ is now in all likelihood firmly under water. I fully expect a revisitation of $50 by the end of this year and have loaded up my investment book accordingly.
Rocketeers,.. Put on your sunglasses,.. The future’s very bright for shiny metals,..
Yours aye,..
Rich (Live from ‘The Bridge of the Silver Rocket Ship’)
Source: MIDAS via Agoracom



 More Charts: 1-Month, 1-Year, 5-Year, 10-Year
 More Charts: 1-Month, 1-Year, 5-Year, 10-Year