Has gold reached an intermediate top and entered into a multi-month correction phase?
After the massive silver take down on May 1, and after several weeks of consolidation, there was much uncertainty as to the direction of silver. On June 21, we featured an article from Richard Guthrie which helped answer the question Silver: Will it be Up or Down? He wrote:
I implore all those still nervous about getting onto this silver rocket to take a long hard look at the following graph.
Based on his analysis, he was certain it was going to be UP. Sure enough, 1 week later, silver started its climb from $33.50 right up to $44, when it was taken down yet again on Aug 23, together with gold. Now, after about 3 weeks of consolidation, there’s this lingering question - Has gold reached an intermediate top and entered into a multi-month correction phase?
True to form, Rich has written another great analysis on why he think it has not, this time by looking at the gold miners price action. This is his story, told with a series of 7 convincing charts.
-
By Richard Guthrie (Live from ‘The Bridge of the Silver Rocket Ship’)
Much of the technical commentary I’m reading is still short term bearish on the direction in the precious metals and there are concerns we’re started a multi-month correction.
However they have conveniently forgotten to include within their analysis the recent action of the miners.
I have charted below the action of the Price of Gold and circled each occasion in the last 8 years when the Price of Gold has topped out and has entered a multi-month correctional phase.
-
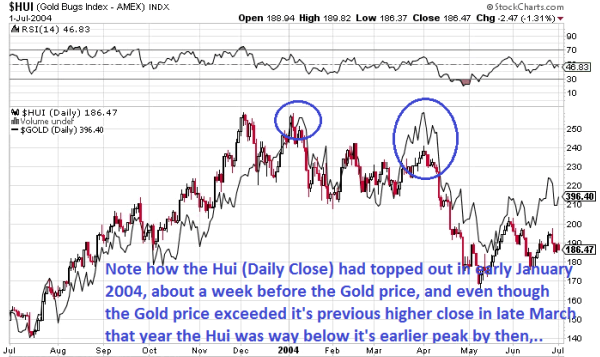
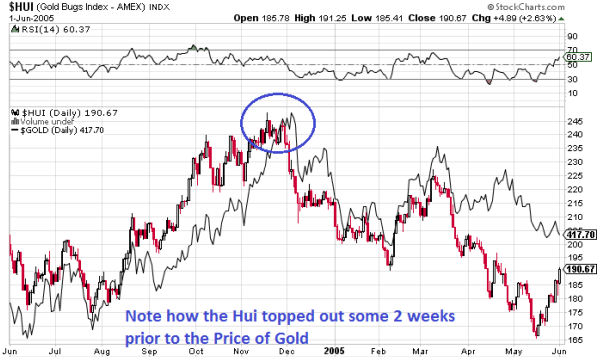
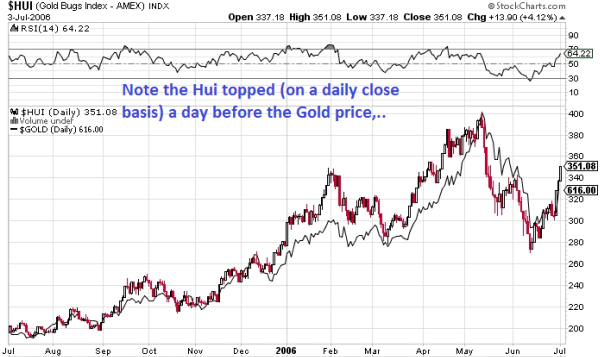
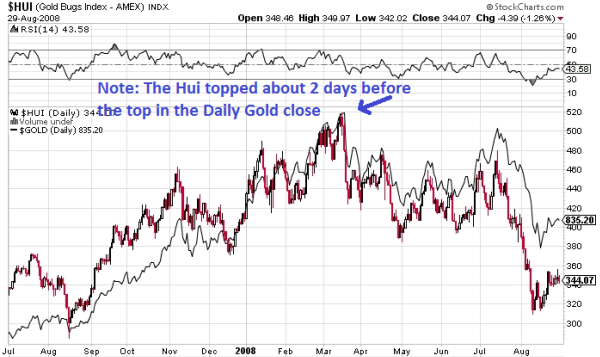
Now let’s look in further detail at the action of the Hui (Gold Miners) Index during those periods of topping out.
The charts below show the Hui price action (Candlestick) with the Price of Gold overlaid (Black line).
-
Early 2004:
 -
-
-
Late 2004:
-
May 2006:
 -
-
-
March 2008:
-
December 2009:
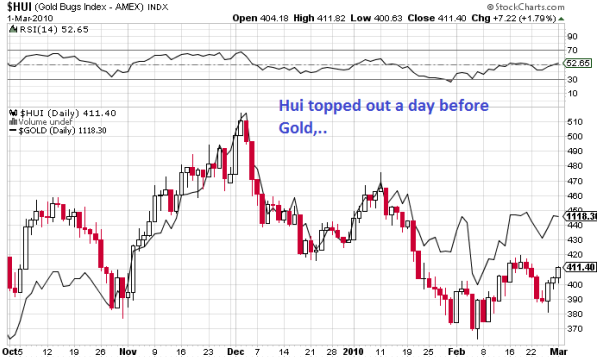
So on every multi-month Top in the price of Gold throughout the duration of this Bull Cycle to date the Hui index has always topped out before the price of Gold.
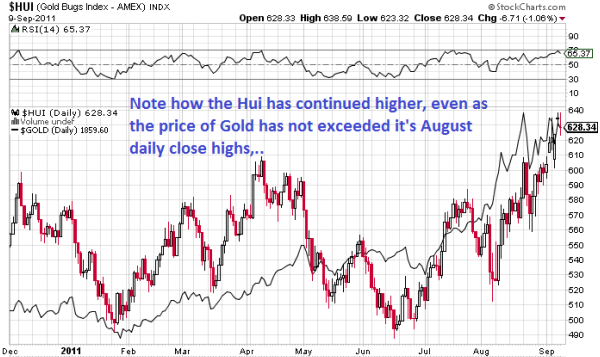
Now let’s look at the present action in Gold and the Hui Miners.
 -
-
As the graph clearly attests while the Gold price peaked (on a daily close basis) some 3 weeks ago in mid August, the Hui Index has been continuing higher and has risen a circa 5% more since then.
In summary, the action of the miners does not indicate that we have reached an intermediate top in the Gold price. If history is to be our guide we should be back to record highs in Gold in the very near future and this present up leg should have plenty more upside to come.
It’s ironic that the ‘Corrective Bear Callers’ always like to make a mockery of the phrase, ‘This Time It’s Different’. Well if indeed we have just topped out in the Gold Price then this time ‘It would truly have to be different‘ from every other intermediate top in this Bull Cycle to date!
I personally don’t believe it will be different and still have every confidence we’ll be well over $2,000 within the next month or so, And that’s where my money lies,
It seems Bully Boy’s shaking a few more weak longs out of his saddle before the next charge north, And who can blame him, No one likes to run with too much weight on his back!
-


 More Charts: 1-Month, 1-Year, 5-Year, 10-Year
 More Charts: 1-Month, 1-Year, 5-Year, 10-Year
