Stock markets rose yesterday and the gold price plunged as investors regained some optimism about the state of the global economy. The German DAX settled 0.84% higher yesterday, with Britain’s FTSE 100 also tacking on a 0.55% gain. In America, the Dow Jones Industrial Average posted a 1.29% increase to settle at 11320.71, while the Russell 2000 index of small-cap stocks recorded a 1.39% gain. Japan’s Nikkei has settled 2% higher today, while Hong Kong’s Hang Seng Index closed up 1.1%.
Price action in the commodity sector was mixed. Copper, Brent crude and Nymex gasoline futures all settled higher – indicative of “risk on” trades being implemented – though precious metals such as silver, platinum and palladium all sold-off. Silver fell by more than $3 an ounce, while the front-month platinum and palladium contracts were down $53 and $21 respectively.
All of this was small fry, however, in comparison with the losses in gold. The August Comex gold contract lost a whopping 5.6% ($104.20) to settle at $1,754.10 per troy ounce. In dollar-terms, this decline is second only to the $143.50 plunge that occurred after the gold price reached an inflation-adjusted peak in January 1980. However, in percentage terms there have been even sharper declines than yesterday’s 5.6% loss in recent years.
Given the incredible gains in the gold price witnessed in recent weeks, such a down move is unsurprising, and is indeed a healthy part of a sustainable bull market. Such moves force speculators and other weak hands out of the market – with more and more committed gold holders using the price dip as an opportunity to buy more physical metal.
Stronger-than-expected US durable goods data for the month of June was partly responsible for the bullish mood on Wall Street and the rout in the gold market. Economists had only expected a 2% increase, when in actual fact the data showed a 4% rise. As Robert Wenzel points out at his blog, the surge in the US money supply in recent months is starting to result in improved economic statistics, as well as rising prices at both the producer and consumer levels.
Margin hikes at the New York Comex and the Shanghai Gold Exchange have also contributed to the downward move in gold prices. The Comex has raised the amount of money needed to trade gold contracts by 27% to $9,450 per 100-ounce contract, following on from the Shanghai Gold Exchange’s decision to raise margin requirements by 26% on Monday. Higher margins mean futures traders must stump up more cash in order to buy and hold gold futures – which tends to encourage selling. Clearing houses will tend to raise margins in response to big price rises, as a means of reducing volatility.
In addition to the above pressures, this week is options expiration week at the Comex. The largest banks operating on this exchange write a lot of the call options on gold futures; thus, they have an incentive to aggressively short gold in the days leading up to and on the day of the expiration of certain calls, so that they expire worthless – meaning that the banks make the maximum profit from selling these options.
None of this should detract from the long-term fundamentals that are underpinning steady rises in precious metal prices. As the old saying goes, bull markets take the stairs up and the elevator down. Or, as the American investor James Dines notes: “the very function of declines in a major bull market is to keep investors out – until the top. The very function of rallies in a major bear market is to keep investors in – until the bottom.”
Gold punched through $1,900 today. If the current financial system can withstand the stress and remained intact till the day gold trades at $20,000 an ounce, what will life be like then?
If we’re holding gold at that time, we may be doing fine but we are not likely to be 10 times richer. That’s because nothing much has happened to our gold. Rather, paper currencies would have lost so much purchasing power that it would take 10 times more of the same to buy what we could buy today. A Big Mac will most likely cost around $43 in the US. In Malaysia, NZ and Britain, it’ll like be around RM76, NZ$54 and £25 respectively (estimates based on Big Mac Index). When a basic meal costs that much, life can be very tough for savers who continued holding on to their paper currencies or other paper assets.
Many of my friends and relatives, from retired professionals to missionaries have been ill advised to rely on supposedly safe or high yielding investments like mutual funds, government managed pension schemes, term deposits or hot stocks to generate passive income or preserve the value of their retirement funds. Despite being presented with information from this website and elsewhere, there’s little affinity shown towards gold or silver. This scares me and for their sake, I hope gold does not get anywhere close to $20,000 before they get on board.
What’s even scarier is the fact that an enormously huge segment of society do not have the means to get on board, even if they wanted to. We’re looking at the 1.4 billion people living on less than NZ$2.25 a day. That’s less than 0.05 ounces of silver! They worry not about the Fed nor the Cartel but about how to provide food, clothing, housing and healthcare with that amount each day. It’s about survival, not savings. Pause for a moment to imagine their plight when gold hits $20,000. Spare them a thought today, and check out their appeal for assistance.
Why $20,000 gold?
In this recently released documentary, Mike Maloney presents the case for $20,000 gold by stepping back and looking at the big picture. He takes us back, very far back, and paints us a very big picture. This excellent educational video is a must watch, especially if you’re new to the Political Metals space. It’ll be your 90 minutes well spent.
But if you can’t spare the time, I’ve highlighted some of his key points with some new charts below for a quick read.
-
Dow/Gold Ratio Chart: Where are we in the Wealth Cycle?
Using the Dow Jones Industrial Average (Dow) as a measure of performance of the equities market in general, the ratio of the Dow to the price of gold indicates the performance of equities market relative to gold. Currently each point of the Dow is worth about 6oz of gold. During the process of correction after the biggest stock market bubble in history, the ratio is expected to head towards the historical mean (4oz) and overshoot it before finding its fair value again.
The bigger the bubble (deviation from mean), the larger the overshoot. During the present cycle, Mike expects the overshoot to touch 0.5:1 (1 oz of gold worth 2 points of Dow). In its extreme, the Dow would have to collapse from 11,000 to 950 if the price of gold remains at current level of $1,900. Conversely, gold will increase to $22,000 if the Dow remains at current levels.
Relative performance of Dow Vs Gold & Silver since Jan 2000
(Worst reference point, at peak of stock market bubble)
Relative performance of Dow Vs Gold & Silver since March 2009
(Best reference point, at the start of QE1)
-
Currency Supply Chart: Where are we in the Inflation/Deflation Cycle?
For simplicity, “money” & “currency” are used interchangeably here. Watch the video to see the difference.
Monetary inflation is the increase in money supply resulting in price inflation (rising prices of goods & services), with a time lag between the former and the latter. The reverse applies to monetary deflation and price deflation. Studying the trend in money supply or the total amount of currency in circulation (CinC) over a period of time gives us an idea of where we are and where we’re heading in terms of inflation and deflation.
Money is created in two stages. The initial Base Money is created by the Fed (or other central banks). More new money is then created (up to 9 times the initial Base Money) within the private banking system through credit. It is loaned into existence. Watch the video to learn more about the money creation process.
The chart above represents the amount of CinC that’s exclusively created by the private banking system. The highlighted area indicates that this component of the overall money supply has dropped by $1.7T since the 2008 crisis. This is the Debt Collapse or Credit Contraction. Less lending by banks results in less money chasing goods and services, leading to price & asset deflation. It is evident from the chart that a contraction of this magnitude has never happened since 1960. The last time it happened was just before the Great Depression of the 1930s.
In response to this credit contraction, and in an attempt to prevent another Great Depression, the Fed has been rapidly increasing the Base Money supply by creating new money. The recent rate of increase is unprecedented. The first trillion dollars was created over a period of about 90 years. The next $1.4T came into existence over the last 2 years!
This rapid increase in Base Money (red chart) was an attempt to offset the decrease in the credit money (blue chart). When we add these two components of money supply together, we obtain the total CinC (Base Money plus Credit Money) as shown in the chart below.
Notice the contraction at the top of the chart, albeit a smaller one. It is evident that despite the frantic pace of money printing by the Fed, it has not succeeded in offsetting the reduction in money supply due to credit contraction.
The Fed has little choice but to continue creating money. With such a large perturbation in total currency supply and due to the complexity and size of the monetary system, it is not possible for the Fed or anyone else to create just sufficient money at just the right rate such that the total CinC won’t overshoot its long term trend. The principle that the larger the deviation from the mean, the larger will be the overshoot during the correction applies here as in the stock market above. The fact that there’s an undetermined time lag, between monetary inflation and price inflation further adds to the likelihood that the next round of money printing will result in a massive overshoot. Coupled with other factors, hyperinflation could be just round the corner.
In his book, Rich Dad’s Advisors: Guide to Investing In Gold and Silver: Protect Your Financial Future, and again in his presentation, Mike predicted the following sequence of events:-
Threat of deflation - At the onset of the 2008 crisis (Past)
Money printing - TARP, QE1, QE2 (Past & more to come)
Big inflation - Here and now (anyone disagree?)
Real deflation - Asset deflation in real estate & stock market (The severe but short deflation is ahead)
Gold Gap Up (a break between prices on a chart that occurs when the price makes a sharp move up with no trading occurring in between) on first trading day after S&P downgraded the US credit rating. This is a very rare event. It closed at another all time high of $1719.80, up 3.3%. Another very rare event (any close above 2% is very very rare).Similar price action is seen in all major currencies - a classic picture of the flight to safety - from fiat currencies to hard currency.
-
Dow plunged 634 points (5.55%) to close at 10,809.85. That’s a loss of 15% from its July high. It was the worst day for the market since the financial crisis in the fall of 2008. So, where did the money go?Ironically, it went into US Treasury bills! Investor fears were so extreme and the sums of transferred money so vast that the yields on the short-term Treasuries were negative, meaning investors were paying the US government to hold their money. A tiny portion would have gone into gold.
-
Gold/Dow Ratio. Combining the 2 charts above, we have a Gold/Dow ratio displaying a spectacular gap up closing at an all time high of 0.1591. It now takes that number of units of Dow to purchase one ounce of gold, which appreciated by over 35% against the Dow over 5 weeks. Put another way, and stepping back to August 2008, the Dow/Gold Ratio chart below shows how much you’d have “lost” if you’d parked your savings in stocks instead of gold. It now takes only 6.29oz of gold to purchase one unit of Dow, compared to 13.3oz 3 years ago, a drop of 53%.
Dow/Gold Ratio
The Dow has lost 58% against Gold over three years
-
Dow/Silver Ratio
The Dow has lost 74% against Gold over three years
Silver has not been running as fast as gold recently. This flight to safety money usually starts to chase gold, with silver catching up later. Gold/Silver Ratio currently stands at around 44, and that offers a great opportunity to stack up on silver.
- Updated Monday, Aug 8. Go directly to updates -
After the markets closed Friday, S&P downgraded US credit rating from AAA to AA+ with a negative watch. Although there have been warnings as far back as April, this is significant because it is the first time the US actually lost its sterling AAA rating since it was granted in 1917. S&P’s full report in pdf. Dagong, the Chinese Credit Rating Company lowered the United States to A+ last November after the U.S. Federal Reserve decided to continue loosening its monetary policy and announced a further downgrade to A earlier in the week.
With this historic downgrade the US credit rating is at par with New Zealand and the bonds of Germany, France, Canada and the UK now have a higher rating.
Initial reactions to the downgrade
Buffet, whose Berkshire Hathaway was downgraded from AAA to AA+ by S&P in February, told FBN late Friday that the downgrade of the United States’ triple-A credit rating “doesn’t make sense.” He further went on to say
If nothing else takes place, meaning, if all other variables hold and there isn’t say, a new problem in Europe, it won’t make any difference. “Think about it. The U.S., to my knowledge owes no money in currency other than the U.S. dollar, which it can print at will. Now if you’re talking about inflation, that’s a different question.”
Peter Schiff, on the other hand, thinks that the downgrade was not low enough! Claiming that he has a higher credibility than S&P for giving the sub prime mortgage related bonds junk status way back in 2006 while S&P continued rating them at triple A, he thinks this downgrade is going to accelerate the flight from the US$ and kick off a self-perpectuating loop of Downgrades > Higher Interest Rates > Weaker Economy > Increased Deficit > More Downgrades.
-
Some seem to think that Wall Street insiders knew of the impending downgrade and have already started to sell down stocks the whole of last week. While the global stock markets lost about 10% last week in the midst of worsening Euro zone crisis, the US$ did not experience the “flight to safety” effect as it did in 2008, despite the fact that Switzerland and Japan intervened aggressively in the market to prop up the dollar. On the other hand, gold hit another weekly all time high despite a slightly stronger dollar.
Gold bugs and holders of hard currencies are eagerly looking forward to an exciting week to see how the big boys move their paper assets around. Would they be chasing perceived relatively stronger fiat currencies like the Euro or still-standing triple A paper assets or would there be a frantic flight to gold (& silver).
-
Any clue from BullionVault’s Round-the-Clock trading physical gold platform?
While all markets are closed for the weekend, BullionVault’s 24×7 physical gold & silver trading platform may give a clue of what’s ahead Sunday night when Asian markets open Monday morning.
Clients at BullionVault are able to trade physical gold & silver with each other (with BullionVault as a dealer) or directly with BullionVault as principal. A recent check online shows that offers have dried up for gold at their New York and London vaults.
Normally, even during weekends, there are active bids and offers at reasonable market depths. See typical screenshots here. At time of writing, there’s only 3.236kg (104oz) on offer at the London vault while the New York vault has only ONE oz (0.031kg) on offer at whopping $1804/oz ($58,000/kg). The markets at Zurich vault looks more normal, albeit at a much higher spread of 0.93%.
-
Finally, Dan Norcini has this to say about in his KWN interview on Aug 6, 2011. Read the interview here.
“I would expect the immediate reaction to the news in Asian trade Sunday evening will be to see the US Treasury markets open lower in a knee jerk reaction with gold opening higher from the get go. Whether or not the bond markets recover is unclear at this time since some of this might have been reflected in the move lower in the bonds just before the close of Friday trading late in the afternoon yesterday.
- Updated 8 Aug (Monday Morning in Asia)
Gold up $25, Dow futures down 276 points when market opens in Asia. Buffet is wrong, Schiff is right!
Monday Morning, Gold jumps to $1690: BullionVault 1-week chart
Since the 2007 Global Financial Crisis, considered by many economists to be the worst financial crisis since the Great Depression, the global economy has been facing a complex inflation/deflation paradox. Many emerging economies are experiencing high inflation in the form of rapidly rising food and energy prices, while more developed western nations are facing high unemployment, low growth, lower inflation and even deflation in some cases.
While economists debate over whether inflation or deflation would take hold, with some arguing that both are coexisting in many economies, investors weary of the currency crises and sovereign debt crises are loosing confidence in the more traditional asset classes and are increasingly flocking to gold as a safe haven.
It is therefore timely that the World Gold Council recently commissioned Oxford Economics to conduct an independent, proprietary research using their respected Global Model, to explore the performance of gold and other assets in various economic situations and examine gold’s role within in an efficient investment portfolio in divergent economic scenarios.
This video outlines how the study was carried out and some broad conclusions drawn from it.
-
- Some of the key conclusions of this study include:-
Gold tends to hold its value in real terms over the long term, but short-run factors like financial stress, political turmoil, real interest rates, inflation and central bank activity can move gold away from its long run equilibrium for extended periods. - Whilst the current price of gold is comparatively high, the adjustment back to equilibrium could take place via a rise in the general price level, rather than a fall in the nominal value of gold. - Gold performs relatively strongly in a high inflation scenario and also quite well in a deflationary environment - such as during a wave of defaults in the eurozone. - Gold is a hedge against extreme events - this may be especially valuable given the considerable uncertainties still facing the world economy. - Gold is useful in stabilizing the performance of a portfolio because it has a lack of correlation with other financial assets (equities, bonds, cash and property).
-
Summarized below are the results of the relative performance of gold against other financial assets under four scenarios (Baseline, Deflation, Stagflation & Inflation). The full report in pdf can be downloaded from the World Gold Council site. Registration is required, but it’s free.
Steady recovery in major economies supported by strong emerging market growth
Easing of financial stress and repair of banking systems
Modest inflation, gradual normalisation of monetary policy, slight dollar appreciation
Gold under performs other assets (Ranking 1 out of 5)
-
Scenario #2
Deflation Massive financial shock leading to renewed recession and falling consumer prices
Major global financial shock, eurozone debt defaults, surge in financial stress levels
Return to recession in major economies, sharp growth slowdown in emerging countries
Price deflation in many countries, steep asset price falls, near zero interest rates
Gold performance helped by sharp initial rise in financial stress (Ranking 3 out of 5)
-
Scenario #3
Stagflation Higher inflation and interest rates but weaker growth than in the baseline
Oil price spike to US$150 per barrel sparks increased wage pressures
Inflation rises to 5% and sticks there, central banks react with higher interest rates
Growth grinds to a halt, financial stress rises
Gold performs better relative to the baseline scenario (Ranking 2 out of 5)
Scenario #4
High Inflation Wage-price spiral and lax monetary policy pushing inflation to double digits and ultimately leading to a sharp monetary tightening and recession.
Faster than expected initial growth closes output gaps
Oil soars to US$200, creating wage-price spiral as central banks are slow to respond
Double-digit inflation, belated rate hikes causing recession & a spike in financial stress
Gold outperforms other financial assets in this scenario (Ranking 5 out of 5)
The rally in equity markets has clearly been surpassed by the rally that we have seen in several commodities, notably, gold but not necessarily only gold and silver. Juerg Kiener, MD & CIO of Swiss Asia Capital, in an interview on CNBC-TV18 spoke about how he sees these asset classes likely to perform especially vis-à-vis other asset classes.


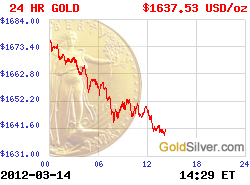
 More Charts: 1-Month, 1-Year, 5-Year, 10-Year
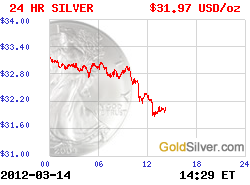
 More Charts: 1-Month, 1-Year, 5-Year, 10-Year
