Continuous Commodity Index at its all-time high. How do Political Metals compare?
Today’s post is all about charts - Continuous Commodity Index (CCI) & Relative performance, Gold/Silver ratios, etc.
The CCI, comprising 17 commodities, is a widely recognized barometer of commodity prices. The rapidly expanding money supply (see earlier posts here & here) as a result of money printing operations QE1 & QE2 has found it’s way into the commodities market. It is at it’s all time high, surpassing the previous peak just prior to the 2008 crash.
The second chart below illustrates how price increases in these 17 commodities compared with other asset classes over 1 year (as at 1 Feb 2011). It should concern everyone that most of the major essential food commodities (except rice) gained over 50% during this period.
See Updated chart as at Sep 12, 2011.
When new money is “created out of thin air”, it quickly find its way, amongst other things, into the commodities and equities market as hot speculative money.This explains why, despite high unemployment and a struggling economy, the S&P managed to hit the 1,300 mark this week.
Here’s another chart showing performance of a narrower selection of 30 US stocks - the Dow Jones Industrial Average over the duration of QE1 and current on-going QE2. Correlation? - YES! Causation? You decide.
While the stocks increase will line the pockets of Wall Street, the commodities and energy price inflation is hurting the Main Street, as evident in the mass revolt in Algeria, Tunisia, Egypt, Yemen and elsewhere. Give it a few months before these super high commodity prices to filter down the food chain. The effects of “12 men & women behind closed doors pressing the button of the printing press” will then be felt far and wide across the globe. Watch the Rough Rice price. When that moves up to the ranks of wheat, corn and oats, the masses will wake up - big time. [London (CNN) -- World food prices rose to an all-time high in January, according to the UN's Food and Agriculture Organization (FAO)].
If you’re holding non-US paper currencies, you may be pleased to note that they have generally “appreciated” against the world’s reserve currency - but not by much. Looks like chump change when compared to increases in real daily essentials. When compared to the rise in commodity prices, anyone using paper currencies as a store of wealth should be very concerned.
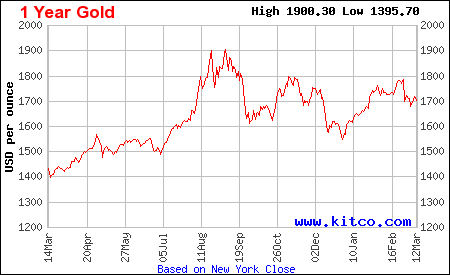
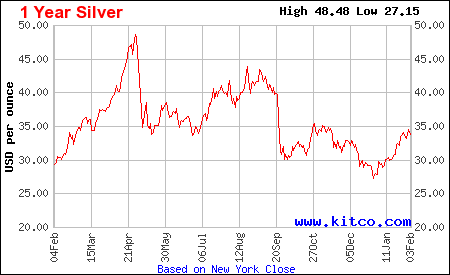
But how do the Political Metals stack up?
However, when PMs are your store of wealth (means of saving), you’re in a far better position to survive the current inflation and impending hyperinflation.
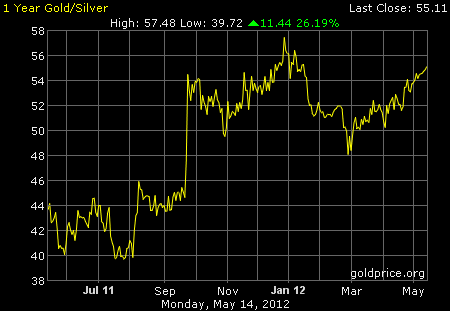
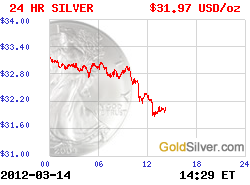
Amongst the four precious metals (Platinum, Gold, Silver & Palladium), clearly the latter two outshines the rest. Two of the four (gold and silver) are Political Metals(PMs). Between the two PMs, silver is considered by many as the “investment of the decade” as gold was for the previous decade. It is also the cheapest amongst the four ($28 compared to $1,800 per oz for platinum), and hence the most affordable to acquire for most people. Currently, the gold/silver price ratio is around 47, and many PMbugs expect it to continue heading south.
Historically, it has been around 16 when both PMs were monetary metals.
Platinum and palladium may also be bought and held as coins, just like gold and silver. However, there is a much smaller market for these two more exotic precious metals. Hence if or when you need to sell or convert out of platinum or palladium, you may have more difficulty finding a physical buyer of your coins. For this reason, the other option of holding these two metals in a reputable vaulting service outside the banking system may be more practical. When it’s time to liquidate them, you can do so very quickly at spot price.
-


 More Charts: 1-Month, 1-Year, 5-Year, 10-Year
 More Charts: 1-Month, 1-Year, 5-Year, 10-Year