Submitted by Richard (Rick) Mills | Ahead of the Herd
-
As a general rule, the most successful man in life is the man who has the best information
-
In 1873, the Fourth Coinage Act was enacted by the US Congress. Western silver miners labeled this measure the “Crime of ’73″ because it stopped the printing of US silver dollars. The US had, unofficially, abandoned its bimetallic standard in favor of a monometallic one – gold.
The supply of silver not being used for coinage increased - European Nations had just gone from a silver to a gold standard, the US was no longer coining silver dollars and these two factors, when coupled with massive new silver discoveries in the American west, caused the price of silver to collapse.
There was once a time in history when people acted. . . . Farmers were trapped in debt. They were the most oppressed of Americans, they experimented with cooperative purchasing and marketing, they tried to find their own way out of the strangle hold of debt to merchants, but none of this could work if they couldn’t get capital. So they had to turn to politics, and they had to organize themselves into a party. . . . The populists didn’t just organize a political party, they made a movement. They had picnics and parties and newsletters and classes and courses, and they taught themselves, and they taught each other, and they became a group of people with a sense of purpose, a group of people with courage, a group of people with dignity.
Lawrence Goodwin, author of The Populist Moment
Western miners, seeking the right to turn silver directly into money, mid-western grain and southern cotton farmers (who both had immense debts because of price deflation caused by overproduction) rallied to silver’s cause and the movement became known as Free Silver. The Populist Party had a strong Free Silver element and its merger with the Democratic Party moved Democrats from being in support of a monometallic gold standard to the Free Silver position.
Free Silver supporters were called “Silverites.”
Silverite’s argued that silver should continue to be part of the monetary standard with gold, their slogan was “16 to 1″ – sixteen ounces of silver would be equal in value to one ounce of gold, using the ratio established in the Coinage Act of 1834.
Silverites also wanted “free coinage of silver” as authorized under the Coinage Act of 1792. Free coinage meant anyone who possessed uncoined gold could bring it to one of the United States Mints and trade it for its equivalent in gold coins, less a small deduction - Free Silver advocates wanted the mints to accept silver on the same principle. These inflationary measures would have increased the amount of money in circulation and helped debtors pay off their debts, while harming creditors and savers.
Opponents to the Free Silver movement were mostly the financial establishments of the Northeast - the moneylenders, creditors, banks, leaseholders, and landlords - they backed a monometallic gold standard - the expanding economy had constrained the money supply available on a gold only standard, this had made the dollar stronger and decreased prices, opponents of Free Silver wanted to keep it that way.
The Republican Party was against Free Silver, the party’s position being that the best way to national prosperity was “sound money.” Republicans favored a continued strong dollar, which rewarded savers and creditors.
Battle lines were drawn, on one side were the Free Silver proponents – miners, farmers, debtors and Democrats - who wanted a bimetallic standard, the free coinage of silver and inflation. On the other side of the line were the creditors and Republicans who wanted to keep a strong currency using a gold only standard.
Intense pressure caused the U.S. government to agree to the Bland-Allison Act of 1878, this act directed the Treasury to purchase silver at a high price. The Sherman Silver Purchase Act was enacted on July 14, 1890. It didn’t authorize the free and unlimited coinage of silver that the Free Silver supporters wanted, but it did increase, by a large amount, the amount of silver the government was required to purchase every month.
Using a special issue of Treasury Notes that could be redeemed for either silver, or gold, the US government became the second largest silver buyer in the world - after the government of India.
By 1893 the US was in one of the worst depressions in American history and people were turning in the new Treasury Notes for gold and depleting the government’s gold reserves. President Grover Cleveland (R) forced the repeal of both the Bland-Allison and Sherman Silver Purchase Acts.
Democrats failed to win any presidential elections in which the Free Silver issue was front and center. When a Democrat, Woodrow Wilson, won in 1912 he signed into law, in 1913, the Federal Reserve Act that created and set up the Democrats version of a Federal Reserve - having congressional oversight.
The Republicans had their own Aldrich Plan for a Federal Reserve - it gave control to private bankers. There was strong opposition, mostly from rural and western states. They feared that the Fed would become a tool of rich and powerful eastern bankers based in New York City - the “Money Trust.”
In 1913 the Pujo Committee Report concluded that a group of influential financial leaders had gained control of US manufacturing, transportation, mining, telecommunications and financial markets - no less than eighteen different major financial corporations were under control of a cartel led by J.P Morgan, George F Baker and James Stillman.
Silver metal was recognized as more precious than gold when bartering in ancient Egypt - this recorded as early as 930 BC. Silver’s use as money in coin form began around 2600 years ago. Silver and gold have stood the test of time, as a medium of exchange, a storehouse of value and a safe haven in times of turmoil.
Back to the future where we find the little bit of history, just presented, made even more fascinating by events unfolding in a Far Far Away place - Washington. Interesting to read a bit about the history of both sides in the now concluded debt ceiling debate.
One might think that the recent drama over the debt ceiling involves one side wanting to increase or maintain spending with the other side wanting to drastically cut spending, but that is far from the truth. In spite of the rhetoric being thrown around, the real debate is over how much government spending will increase.
No plan under serious consideration cuts spending in the way you and I think about it. Instead, the “cuts” being discussed are illusory, and are not cuts from current amounts being spent, but cuts in projected spending increases. This is akin to a family “saving” $100,000 in expenses by deciding not to buy a Lamborghini, and instead getting a fully loaded Mercedes, when really their budget dictates that they need to stick with their perfectly serviceable Honda. But this is the type of math Washington uses to mask the incriminating truth about their unrepentant plundering of the American people.
Ron Paul (R)
Only a third of mined silver production comes from the production of primary silver mines, the rest comes from mined production of other metals, namely zinc and lead, 25% is from production of copper mines (Chile has very little primary silver production but is the fifth largest silver producing country) and the rest is from production at gold mines.
Mined silver production rose by 2.5 percent to 735.9 M oz in 2010 - gains came from primary silver mines and as a by-product of lead/zinc mining activity. Silver produced as a by-product of gold mining fell four percent in 2010.
Tom Albanese, CEO Rio Tinto Group, the world’s second largest mining company, said that the copper industry has struggled to maintain supply because of declining ore grades (ore grades averaged 0.76 percent copper content in 2009, compared with 0.9 percent in 2002), delays to mine expansions and disruption from strikes. Christine Meilton, chief consultant at CRU Group said there was a risk some copper projects, expected to come on stream in 2012 and 2013, will be delayed because of red tape, poor infrastructure and funding difficulties.
A Report by the APS Panel on Public Affairs and the Materials Research Society coined the term “energy-critical element” (ECE) to describe a class of chemical elements that currently appear critical to one or more new, energy related technologies.
Energy-related systems are typically materials intensive. As new technologies are widely deployed, significant quantities of the elements required to manufacture them will be needed. However, many of these unfamiliar elements are not presently mined, refined, or traded in large quantities, and, as a result, their availability might be constrained by many complex factors. A shortage of these energy-critical elements (ECEs) could significantly inhibit the adoption of otherwise game-changing energy technologies. This, in turn, would limit the competitiveness of U.S. industries and the domestic scientific enterprise and, eventually, diminish the quality of life in the United States.
The focus of the report was on energy technologies with the potential for large-scale deployment so the elements they listed are energy critical: silver was listed as one of their choices based on its use in advanced photovoltaic solar cells, especially thin film photovoltaics.
Conclusion
Silver investment rose by 40% during 2010 to 279.3 million ounces, almost double the amount for 2009. Demand increased to 167.0 M ozs (+5.1%) for jewelry and 101.3 M ozs (+22%) for coins. Other major usage categories are photography (72.7 M ozs, down 8.3%), and silverware (50.3 million ozs).
Industrial use accounted for the bulk of silver fabrication demand in 2010, 487.4 million ounces, up from 403.8 million ounces in 2009 - an annual increase of 20.7 percent.
Total silver demand in 2010 jumped 14.59 percent while the silver surplus - the difference between supply and fabrication demand - dropped 12 percent to 173.4 million ounces. Primary silver mining cash costs were unchanged at $5.27 an ounce in 2010.
The Federal Reserve first issued its debt based paper money in 1913. Since then the US dollar has lost plus 95% of its value. The history of fiat money has always been one of failure. The US dollar was backed by gold and silver, then just gold - the dollar use to be the rock all the worlds currencies were anchored to but when it became fiat, all the worlds currencies became fiat.
The Hong Kong Mercantile Exchange (HKMEx) has recently announced that they will roll out Yuan denominated silver futures contracts. This exchange will:
- Grant Asian investors direct access to silver futures
- Blunt U.S. dominance in silver trading by reducing the importance and influence of the Chicago Mercantile Exchange (CME)
According to the HKMEx China is already becoming a factor in the silver market. From 2008 to 2010, silver demand soared 67% in China and China accounted for nearly 23% of global silver consumption in 2010.
In 2010 India consumed 2,800 tonnes of silver, 2011’s consumption is forecast to rise to 5,000 tonnes. India’s state-owned trading company - Minerals and Metals Trading Corporation (MMTC) said it would import 1,200 tons of Silver in 2011-12 as demand for the precious metal is rising fast.
The rising demand for silver bullion products with 99.99% fineness has started a new trend - silver denominated notes reminiscent of turn of the century American silver certificates are becoming quite popular in India, the difference is, these Indian notes are actually made of silver.
The silver notes closely resemble the country´s rupee and are very popular among the country´s younger generation and rapidly growing middle class. The nominal value of each note corresponds to its respective weight in silver - a note with a face value of 10 rupees is equal to 10 grams of silver.
Silver should be on every investors radar screen. Is it on yours?
If not, maybe it should be.
Richard (Rick) Mills
[email protected]
www.aheadoftheherd.com
Richard is host of Aheadoftheherd.com and invests in the junior resource sector. His articles have been published on over 300 websites, including: Wall Street Journal, SafeHaven, Market Oracle, USAToday, National Post, Stockhouse, Lewrockwell, Uranium Miner, Casey Research, 24hgold, Vancouver Sun, SilverBearCafe, Infomine, Huffington Post, Mineweb, 321Gold, Kitco, Gold-Eagle, The Gold/Energy Reports, Calgary Herald, Resource Investor, Mining.com, Forbes, FNArena, Uraniumseek, and Financial Sense.
Legal Notice / Disclaimer
This document is not and should not be construed as an offer to sell or the solicitation of an offer to purchase or subscribe for any investment. Richard Mills has based this document on information obtained from sources he believes to be reliable but which has not been independently verified; Richard Mills makes no guarantee, representation or warranty and accepts no responsibility or liability as to its accuracy or completeness. Expressions of opinion are those of Richard Mills only and are subject to change without notice. Richard Mills assumes no warranty, liability or guarantee for the current relevance, correctness or completeness of any information provided within this Report and will not be held liable for the consequence of reliance upon any opinion or statement contained herein or any omission. Furthermore, I, Richard Mills, assume no liability for any direct or indirect loss or damage or, in particular, for lost profit, which you may incur as a result of the use and existence of the information provided within this Report.
Richard Mills does not own shares of any companies mentioned in this report.


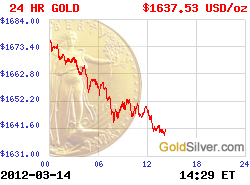
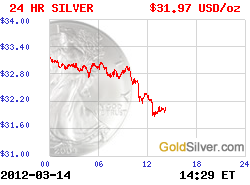
 More Charts: 1-Month, 1-Year, 5-Year, 10-Year
 More Charts: 1-Month, 1-Year, 5-Year, 10-Year

Recent Comments