Archive

Archive for the ‘Articles from external sources’ Category

150 Years Of U.S. Fiat Currency

April 9, 2012 1 comment

-

5 days ago saw the 150th year anniversary of an event so historic that a very select few even noticed: the birth of US fiat. Bloomberg was one of the few who commemorated the birth of modern US currency: “On April 2, 1862, the first greenback left the U.S. Treasury, marking the start of a new era in the American monetary system…. The greenbacks were originally intended to be a temporary emergency-financing measure. Almost bankrupt, the Treasury needed money to pay suppliers and troops. The plan was to print a limited supply of United States notes to meet the crisis and then have people convert the currency into Treasury bonds. But United States notes grew in popularity and continued to circulate.” The rest, as they say is history.

In the intervening 150 years, the greenback saw major transformations: from being issued by the Treasury and backed by gold, it is now printed, mostly in electronic form, by an entity that in its own words, is “set up similarly to private corporations, but operated in the public interest.” Of course, when said public interest is not the primary driver of operation, the entity, also known as the Federal Reserve is accountable to precisely nobody. Oh, and the fiat money, which is now just a balance sheet liability of a private corporation, and thus just a plug to the Fed’s deficit monetization efforts, is no longer backed by anything besides the “full faith and credit” of a country that is forced to fund more than half of its spending through debt issuance than tax revenues.

More on the history of American fiat from Bloomberg:

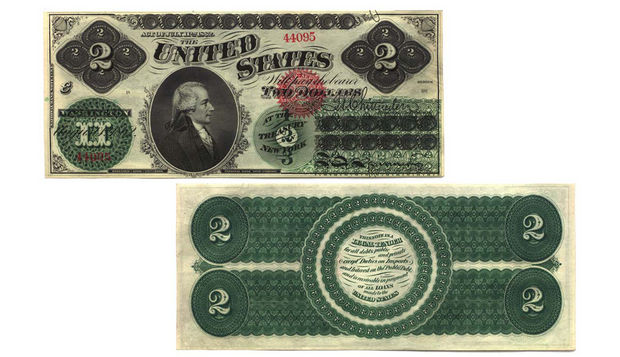
At the start of the Civil War, the U.S. didn’t have a national paper currency. Instead, the money supply consisted of U.S. coins and a collection of paper notes issued by private banks. Technically, the federal government began issuing its own paper currency in 1861. That year, the Lincoln administration issued $60 million in demand notes, a variant of a Treasury note that was redeemable “on demand” for gold coins at the Treasury or any sub-Treasury.

These notes were overshadowed in 1862 by the issue of $150 million in a new fiat currency officially known as United States notes and popularly known as greenbacks or legal tenders. By the end of the war, close to $450 million worth of greenbacks were in circulation.

The name greenbacks referred to the reverse of the notes, which were printed in green. The name legal-tender notes referred to the text that originally appeared on the back, which began, “This note is legal tender for all debts, public and private.” This provision made the currency a valid form of payment on par with gold and silver, which was a very controversial action at the time. It made the United States note a fiat currency — meaning its value was established by law alone and wasn’t based on some other unit of value, such as gold, silver or land.

Many Americans during and after the Civil War believed the creation of a fiat currency was unconstitutional. The Constitution explicitly stated that only gold and silver could be considered legal tender. In 1871, in the case of Knox v. Lee, the Supreme Court settled the matter by declaring that making United States notes legal tender was indeed constitutional.

By this time, the greenback was at the center of a countrywide debate on monetary policy. When the post-Civil War economic boom ended in the panic and depression of 1873, many people, especially farmers, blamed the Treasury’s policy of contracting the currency — that is, removing United States notes from circulation in an attempt to go back to the gold standard, which would require that a $1 note could be redeemed for $1 in gold.

As a consequence, there was a call for the expansion of United States note circulation or an inflation of the currency. This belief became joined with a political ideology that opposed big business and banking interests, resulting in the birth of the Greenback Party in 1874.

Opposing the Greenbackers were more conservative interests, sometimes known as “gold bugs,” who found support in the Republican Party and in elements of the Democratic Party. Gold interests proved the stronger contestant in the debate and in 1878, the total circulation of United States notes was fixed at a little over $346 million and the notes eventually became redeemable in gold (at least until 1933, when this provision was removed).

During the 20th century, United States notes became ever less important in the nation’s money supply, though Congress supported their continued circulation. They were increasingly replaced by currency issued by the Federal Reserve System, which came to look almost identical to the United States note. The Federal Reserve note thus became the new greenback.

In 1966, Congress allowed the Treasury to start removing United States notes from circulation. The last delivery of the notes by the Bureau of Engraving and Printing to the Treasury was made in 1971. In 1994, the Riegle Community Development and Regulatory Improvement Act eliminated the issuance of the notes altogether.

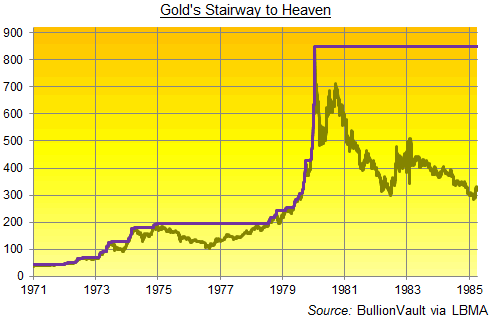
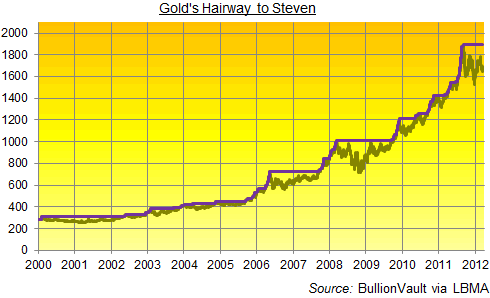
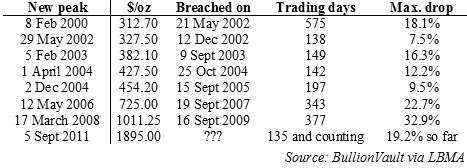
So instead of real money, America has an impostor “which came to look almost identical to the United States note” with the full complicity of everyone in charge, just so that when needed, any and all untenable debt burdens can be inflated away. And while the latter is a topic of a whole different discussion, we present another chart which, unlike the 150th anniversary of fiat, should be something discussed far more broadly… Because in a fiat world superpower status is always relative.

-

Source: ZeroHedge

Related Articles:

Gold’s Hairway to Steven

March 16, 2012 Leave a comment

Submitted by Adrian Ash | BullionVault

-

It’s now 6 months since gold hit its current all-time high. How long ’til the next…?

Thanks to hindsight, the bull market in gold which followed Richard Nixon unpegging the US Dollar, and therefore the rest of the world, from its last pretence of a Gold Standard sounds as inevitable today as Jimmy Page’s solo in Stairway to Heaven, also a 1971 classic.

But the gold price’s rise from $35 per ounce to $850 in less than a decade hardly ran that smooth at the time.

Gold's Stairway to Heaven

Hitting a new record high of $70 per ounce within a year of floating free from the Dollar, gold took 6 months to reach and breach that high again. The gold price then took a further six months to break the next July’s top at $127…then almost 7 months to break spring 1974′s high at $179.50…and then more than three years to top that winter’s peak of $195.25 per ounce.

Knowing not to sell but hang tight wasn’t easy. Not least because US investors had only just got in at the top. Nixon’s successor as US president, Gerald Ford made buying gold legal for the first time in three decades on the last day of 1974. But planning ahead, international bullion dealers had already pushed the price to that peak of $195 per ounce just 1 day earlier. So come the middle of 1976, America’s earliest buyers had lost 45% before costs.

Who could have said for sure that they would recover not only that loss, but make a further 355% gain on top, when gold finally peaked at the start of 1980 - the same year Zeppelin broke up? And who could have guessed that second peak would then prove gold’s ultimate climax - way up there, as high as heaven itself - for nearly three decades, longer even than a live Jimmy Page solo?

Gold's Hairway to Steven

Fast forward to spring 2012, and it’s now six months since gold hit what remains, for now, its latest all-time peak - a London Gold Fix on 5 Sept. 2011 of $1895 per ounce.

Just how long might gold owners wait to see it get there again? To date, the 21st century bull market has enjoyed seven breathers longer than this one so far. Ignore the first (it took the gold price very nearly back to 1999′s two-decade low beneath $253), and the average wait in these extended pauses has been nearly 11 months.

Chart

As you can see, higher prices are harder work to recover. The one before this - which began the day Bear Stearns imploded - took the gold price one-third lower for US investors. Its next peak (if not its final crescendo) came 180% higher from there.

Think of it more as Hairway to Steven than Stairway to Heaven. Because like the Butthole Surfers, investors either love gold or hate it, and the vast majority don’t get it at all. It makes one hell of a racket, terrifying and surprising those who dare to go near it, pounding onwards and upwards, right until the moment it falters and stops.

“Eventually, there will be a crisis of such magnitude that the political winds change direction, and become blustering gales forcing us onto the course of fiscal sustainability,” says Dylan Grice, strategist at Société Générale in his new Popular Delusions report for clients.

“Until it does, the temptation to inflate will remain, as will economists with spurious mathematical rationalisations as to why such inflation will make everything OK…Until [then], the outlook will remain favorable for gold. But eventually, majority opinion will accept the painful contractionary medicine because it will have to. That will be the time to sell gold.”

In the meantime, investors and savers cannot know that they are buying an uptrend instead of the top. Gold took very nearly 28 years to recover the big top of Jan. 1980 - way up there at $850 per ounce. That topped the 25-year recovery in US stocks after 1929′s Great Crash. We won’t know if Japan sets a new record pause with its stocks and real estate until November 2017. But the 30-year bull market in US Treasury bonds is sure to leave a heavenly high-water mark when interest rates turn upwards from today’s all-time historic lows.


This Is What Volatility Looks Like

March 7, 2012 Leave a comment

-

Today, gold & silver gave up another 2% & 3.4% respectively, bringing the plunge from their Wednesday’s intraday highs to 7% & 14% respectively. That’s over 4 trading days. The volatility in both directions is obvious as shown in this  2-year silver daily chart. The gold chart is no different.

Let’s take a closer look at what the price actions for both metals were like in the more distant past and what to expect over the coming months. Reproduced below is an analysis of daily price volatility by Jeff Clark, Senior Precious Metals Analyst, Casey Research.

-

This Is What Volatility Looks Like

Last Wednesday, February 29, gold dropped 4.8% and silver 6.2% (based on London fix prices). That’s quite the fall for one day. We’ve seen prices that have risen that much, too. But as I’m about to show, these ain’t nothin’, baby.

Based on our experience, we’ve been saying for some time that volatility will increase as the markets fight their way to the mania phase of this cycle - and that once there, the gyrations will jump even higher. This call doesn’t exactly require one to go out on a limb; it makes sense since more investors will be crowding in - and volatility was high in the 1979-’80 mania.

First, let’s put last Wednesday’s big plunge in perspective. Here’s a picture of the daily changes in the gold price since 2003, based on London fix prices. (This chart is very busy, but I want to show the bulk of the bull market in one visual.)

(Click on image to enlarge)

A 4.8% decline is one of gold’s bigger one-day movements over the past nine-plus years. But as you can see, there have been a number of days where gold rose or fell more than 5%. And it exceeded 6% on five occasions.

Here are the data for silver.

(Click on image to enlarge)

Last Wednesday’s decline of 6.2% was one of the metal’s bigger one-day movements. However, it’s exceeded 10% on 14 occasions, 15% three times, and rose an incredible 20.06% on September 18, 2008.

You might think this kind of volatility is high - and it’s true. Worse - or better, depending on how you see things - the volatility in the underlying commodity is magnified in the related company stocks. This is why Doug Casey calls mining stocks, especially the juniors, “the most volatile stocks on earth.” But the thing is, metals volatility has been higher in the past, particularly during a mania.

Here’s what I mean.

The following chart documents gold’s daily price changes from 1976 through the end of 1980. Take a look at the jump in volatility in 1979-’80.

(Click on image to enlarge)

Volatility became the norm in 1979 and especially 1980. Fluctuations of 4% or more were not uncommon.

Here’s the same chart for silver. The metal’s volatility during the 1979-’80 period became extreme.

(Click on image to enlarge)

Daily price movements of 6% or more didn’t occur once prior to 1979 - but then they became commonplace.

I wanted to take a closer look at the biggest price fluctuations during this period, so I ferreted out the largest days of volatility for each metal. For gold, I selected daily movements of greater than 5%.

(Click on image to enlarge)

During this five-year period, gold saw fluctuations greater than 5% on 38 days (19 up, 19 down). Not surprisingly, more “up” days occurred leading up to gold’s peak of January 21, 1980, and more down days came after it.

And yes, gold rose an incredible 13.3% on January 3, 1980. As it turned out, that biggest one-day rise was only 18 calendar days away from the very peak of the market. And the biggest decline of 13.2% on January 22, 1980 was the signal that the top was in.

For silver, I used one-day movements of 10% or more, all of which occurred in 1979 and 1980.

(Click on image to enlarge)

The silver price had fluctuations of 10% or more on 34 days (17 up, 17 down). They occurred over a period of only 15 months, an average of more than two per month.

And yes, silver really did rise a whopping 36.5% on September 18, 1979.

So while last Wednesday’s price movements for gold and silver were big, we simply haven’t seen this kind of volatility in our current bull market.

Now let’s have some fun. Let’s say we match the most volatile days from 1979-’80 at some point before the current bull market is over. If we use gold’s biggest up day (13.3%) and biggest down day (13.2%), here’s what would happen to prices from various levels. Remember, these areone-day gains and retreats:

Gold Price
+13.3%
-13.2%
1,700
1,926.10
1,475.60
1,750
1,982.75
1,519.00
1,800
2,039.40
1,562.40
1,900
2,152.70
1,649.20
2,000
2,266.00
1,736.00
2,250
2,549.25
1,953.00
2,500
2,832.50
2,170.00
2,750
3,115.75
2,387.00
3,000
3,399.00
2,604.00
4,000
4,532.00
3,472.00
5,000
5,665.00
4,340.00

Imagine gold jumping from $1,800 to $2,039.40 in one day!

However, unless you think $1,800 is the level from which the mania starts, it’s more likely we’d see a 13.3% advance (or something similar) from a higher starting point. We’d thus probably see gold jumping to $5,665 from $5,000, for example. And further, that would probably signal we’re near the top.

Keep in mind that volatility worked both ways during the mania, so dropping from $4,000 to $3,472 or something similar is likely to occur as well.

Here’s the same table for silver, with its biggest up day of 36.5% and down day of 18.5%.

Silver  Price
+36.5%
-18.5%
30
40.95
24.45
35
47.78
28.53
40
54.60
32.60
50
68.25
40.75
60
81.90
48.90
70
95.55
57.05
80
109.20
65.20
90
122.85
73.35
100
136.50
81.50
125
170.63
101.88

Can you imagine silver starting the day at $80 and hitting $109.20 before you go to bed that night? Something like that will probably happen at least once before this bull market is over. As with gold, though, that kind of movement is more likely to take place from a higher level, such as $100 or $125 (or higher?). And a fall like $100 to $81.50 will probably be part of the trend as well.

There are some definite conclusions we can draw from the historical picture:

  • First, if history repeats, or even rhymes, our biggest days of volatility are ahead. And they will be normal.
  • Second, big price fluctuations will be common as we enter the mania and approach the peak. In fact, when large daily movements become the norm, the historical record suggests we will be nearing the end of the cycle.
  • Third, since current volatility has thus far been lower than what was experienced during the final phase of the 1970s bull market, we are probably not in a bubble, nor yet in the mania phase, and nowhere near the top. Remember that the next time you hear some nincompoop spew bubble talk on CNBC.

What can an investor do with this information? Prepare yourself for bigger daily swings - in both directions. And buying on those outsized drops is probably a good strategy…

Because we now know what volatility looks like.

Marc Faber “This year the gold price may not exceed the $1,922/oz high that we reached on Sept. 6″

March 6, 2012 4 comments
Marc Faber | Photo: LNS

Marc Faber | Photo: LNS

-

In a recent interview with The Gold Report, Marc Faber - an economist & publisher of the Gloom Boom & Doom Report shared his views on a wide range of topics. Republished below is an extract of his interview covering gold & silver. He opines that gold is in a bull market and that the corrections seen in gold may not be over yet.

The Gold Report: What captures the imagination of investors?

Marc Faber: Basically mania fed by excessive liquidity, with more and more people convinced that something is the Holy Grail. It was the NASDAQ in 2000, Asia before 1997, housing from 2000 to 2006–2007, or more recently China. Exactly what it is, I don’t know. But when a market has been strong, the media write about it and people are attracted to it. Then some useless academics write books about why stocks, or real estate, always go up, and so forth. The media again write that up, and more people flow into that sector.

TGR: A couple of weeks ago James Turk told us that he thinks the low price for gold in 2012 was already established early in January. What makes you think it will pull back?

MF: The big rally into Sept. 6, 2011, took the gold price to $1,922/ounce (oz) and then it dropped until the end of the year, touching $1,522/oz on Dec. 29. It has rallied, and is now above $1,700 again, but I don’t think the correction is entirely over. Corrections of 40% are nothing unusual in a bull market.

As an adviser, my duty is to always inform people of investment risk. I’m not saying I expect gold to collapse, but telling people the gold price will go up leads them to leverage up and speculate. If the gold price drops $50/oz, they’re wiped out. All I’m saying is that, in my opinion, the gold price correction is not yet entirely completed. I see significant support around the $1,500/oz level, but it could drop lower. It depends on global liquidity and on money printing by central banks. We could have a big correction if global liquidity tightens or they stop printing money.

TGR: Over what timeframe are you looking at the correction?

MF: This year the gold price may not exceed the $1,922/oz high that we reached on Sept. 6. Maybe it will. I’m not a prophet. I’m just telling people that I’m buying gold and holding it. I don’t speculate in gold. If you buy gold, you better understand that the price could always move to the downside. If you don’t understand that, don’t invest in gold—or in anything.

TGR: Investment show commentators have been talking about gold being in one of those mania bubbles you described because it’s been increasing for 11–12 years. Do you agree?

MF: No, gold is not in a bubble. It wasn’t in a bubble in 1973, either, but it still corrected by 40% then. I don’t believe gold is anywhere near a bubble phase. A bubble phase is characterized by the majority of market participants being involved in a market space. I saw a gold bubble in 1979–1980, when the whole world was dealing—buying and selling gold 24-hours a day, globally.

TGR: But not since then?

MF: No. If you went to an investment conference in 1989, 90% of the people there would have told you they owned shares in Japanese companies. In 2000, 90% of them would have said they owned NASDAQ shares. Only about 5% of the participants at an investment conference today would tell you they own gold. Very few people in this world own gold.

I don’t believe that we’re in a bubble.

TGR: Should people who aren’t yet in gold or want to add to their position wait for a correction?

MF: I have argued for the last 12 years that investors should buy a little bit of physical gold every month and put it aside without concerns about corrections. If you don’t own any gold, I would start buying some right away, keeping in mind that it could go down.

For the last 40 years in my business I’ve seen people always lose money when they put too much money into something and then it goes down. They panic and sell, or they have a margin call to sell—and lose money. I own gold. It’s my biggest position in my life. The possibility of the gold price going down doesn’t disturb me. Every bull market has corrections.

TGR: What do you think about silver as an alternative precious metal to hold?

MF: Gold and silver will move in the same direction, up together or down together. At times, silver will be stronger relative to gold, and at other times gold will be stronger relative to silver. My friend Eric Sprott thinks that silver will go ballistic. I don’t know. I own gold.

TGR: You’re on record as recommending that investors maintain diversified portfolios, with 20% to 30% each in gold, real estate, equities and cash. Focusing on equities, as we’ve discussed, means tremendous volatility. What are your thoughts? High value? Large cap? Dividends? Something more speculative, perhaps gold mining shares?

MF: Because I live in Asia, I am quite familiar with the Asian markets and economies. I have a bias toward Asian equities, especially because I can find deals in places such as Malaysia, Thailand, Singapore and Hong Kong—stocks that give me 4–7% dividend yields. With yields at those levels, at least I’m paid to wait. Even if they’re cut 5%, I’d still get better cash flow than I would from, say, U.S. government bonds. Consequently, I feel reasonably confident owning such shares.

Because I have allocated only 25% of my portfolio to equities, if the markets were to drop 50%, I would have funds elsewhere in my portfolio to buy more equities. That’s not a prediction for a 50% market decline; it’s just to say that I’m positioned in such a way that I could put more money in equities through a) my cash flow, b) my income and c) my cash position. And I do own some gold shares through stock options, because I’m a director of several exploration companies.

-

Read the full interview covering his investment views on bonds, stocks and real estate at The Gold Report.


Silver Eagles Soar

February 18, 2012 1 comment

Submitted by: Richard (Rick) Mills | Ahead of the Herd

-

As a general rule, the most successful man in life is the man who has the best information

In World War I severe material shortages played havoc with production schedules and caused lengthy delays in implementing programs. This led to development of the Harbord List – a list of 42 materials deemed critical to the military.

After World War II the United States created the National Defense Stockpile (NDS) to acquire and store critical strategic materials for national defense purposes. The Defense Logistics Agency Strategic Materials (DLA Strategic Materials) oversees operations of the NDS and their primary mission is to “protect the nation against a dangerous and costly dependence upon foreign sources of supply for critical materials in times of national emergency.”

The NDS was intended for all essential civilian and military uses in times of emergencies. In 1992, Congress directed that the bulk of these stored commodities be sold. Revenues from the sales went to the Treasury General Fund and a variety of defense programs - the Foreign Military Sales program, military personnel benefits, and the buyback of broadband frequencies for military use.

American Silver Eagle

The American Silver Eagle is the official silver bullion coin of the United States. It was first released by the United States Mint on November 24, 1986 and is struck only in the one troy ounce size.

American Silver Eagle
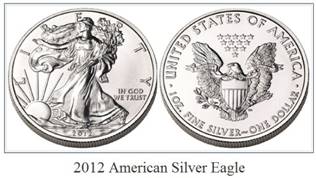
The Bullion American Silver Eagle sales program ultimately came about because the US government wanted, during the 1970s and early 1980s, to sell off what it considered excess silver from the Defense National Stockpile.

“Several administrations had sought unsuccessfully to sell silver from the stockpile, arguing that domestic production of silver far exceeds strategic needs. But mining-state interests had opposed any sale, as had pro-military legislators who wanted assurances that the proceeds would be used to buy materials more urgently needed for the stockpile rather than merely to reduce the federal deficit.” Wall Street Journal

The authorizing legislation for the American Silver Eagle bullion sales program required that the silver used for the coins had to be from the Defense National Stockpile. By 2002 the DNS stockpile was so depleted of silver that if the American Silver Eagle bullion sales program was to continue further legislation was required.

On June 6, 2002, Senator Harry Reid (D-Nevada) introduced the Support of American Eagle Silver Bullion Program Act to “authorize the Secretary of the Treasury to purchase silver on the open market when the silver stockpile is depleted.”

2002 - 10,539,026 Bullion American Silver Eagles were sold.

2003 - 8,495,008 Bullion American Silver Eagles were sold, silver averaged $4.88 an ounce for the year.

2004 - 8,882,754 Bullion American Silver Eagles were sold. For 2004 the average cost of an ounce of silver was $6.67.

2005 - 8,891,025 Bullion American Silver Eagles were sold. Silver averaged $7.32 an ounce.

2006 - 10,676,522 Bullion American Silver Eagles were sold. Silver averaged $11.55 an ounce

2007 - 9,028,036 Bullion American Silver Eagles were sold.

2008 - 20,583,000 Bullion American Silver Eagles were sold. Silver averaged $14.99 an ounce and almost 80% more Bullion American Silver Eagles were sold then in any previous year.

The US Mint suspended sales of the silver bullion coins to its network of authorized purchasers twice during the year.

In March 2008, sales increased nine times over the month before - 200,000 to 1,855,000.

In April 2008, the United States Mint had to start an allocation program, effectively rationing Silver Eagle bullion coins to authorized dealers on a weekly basis due to “unprecedented demand.”

On June 6, 2008, the Mint announced that all incoming silver planchets were being used to produce only bullion issues of the Silver Eagle and not proof or uncirculated collectible issues.

The 2008 Proof Silver Eagle became unavailable for purchase from the United States Mint in August 2008.

2009 - 30,459,000 Bullion American Silver Eagles were sold

On March 5, 2009, the United States Mint announced that the proof and uncirculated versions of the Silver Eagle coin for that year were temporarily suspended due to continuing high demand for the bullion version.

On October 6, 2009, the Mint announced that the collectible versions of the Silver Eagle coin would not be produced for 2009.

The sale of 2009 Silver Eagle bullion coins was suspended from November 24 to December 6 and the allocation program was re-instituted on December 7.

Silver Eagle bullion coins sold out on January 12, 2010.

The average cost of an ounce of silver in 2009 was $14.67

2010

No proof Silver Eagles were released through the first ten months of the year, and there was a complete cancellation of the uncirculated Silver Eagles.

Production of the 2010 Silver Eagle bullion coins began in January instead of  December as usual. The coins were distributed to authorized dealers under an allocation program until September 3.

In 2010 the US Mint sold 34,700,000 Bullion American Silver Eagle Coins.

2011

According to the USGS’s most recent Silver Mineral Industry Survey, silver production fell to 37 tonnes in October - compared to 53 tonnes year over year (yoy).

In 2011, the United States produced approximately 1,054 tonnes of silver – down from 2010’s production of 1,154 tonnes and down from 2007’s production of 1,163 tonnes.

Silver Chart
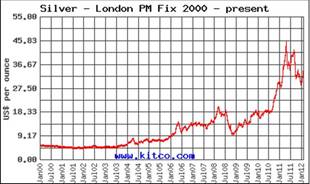
The US imported 6,600,000 oz of silver for consumption in 2011 – up from 2007’s imports of 4,830,000 oz.
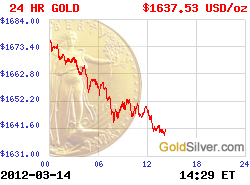
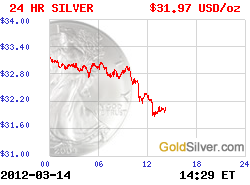
In 2011 the US Mint sold 39,868,500 Bullion American Silver Eagle Coins.

2011 was the first year in which official coin sales will surpass domestic silver production.

Jeff Clark of Casey Research writes“For the first time in history, sales of silver Eagle and Maple Leaf coins surpassed domestic production in both the US and Canada. Throw in the fact that by most estimates less than 5% of the US population owns any gold or silver and you can see how precarious the situation is. A supply squeeze is not out of the question – rather it is coming to look more and more likely with each passing month.”

The US Mint is required by law to mint the bullion Silver Eagles to meet public demand for precious metal coins as an investment option. The numismatic versions of the coin (proof and uncirculated) were added by the Mint solely for collectors.

2012

United States Mint Authorized Purchasers (AP’s) ordered 3,197,000 Bullion American Silver Eagle Coins on January 3rd, the first day they went on sale. That opening day total catapulted January Bullion Eagle sales higher than half of the monthly totals in 2011.

As of January 25th 2012, 5,547,000 Bullion American Silver Eagle Coins had been sold.

Bullion Silver Eagles are guaranteed for weight and purity by the government of the United States and because of this the US government allows bullion Silver Eagles to be added to Individual Retirement Accounts (IRAs).

Conclusion

The twin policies of zero interest rates and the continual creation of money and credit being enacted today, by all governments and central banks, means that the purchase of precious metals is the only way to protect the value of your assets.

“Mark my words, if the interest rates on U.S. government debt truly reflected both the real level of inflation in this country and the rising risk of some form of default, rates would already by sky-high and the U.S. would resemble a massive Greece.”  John Embry, Chief Investment Strategist, Sprott Asset Management

Investors are currently risk adverse and mining stocks are not well understood by the general investing public, but at least one thing is going to become very apparent to most -  the best way to hedge yourself against inflation could be owning silver.

Junior resource companies offer the greatest leverage to increasing demand and rising prices for silver. Junior resource companies are soon going to have their turn under the investment spotlight and should be on every investors radar screen. Are they on yours?

If not, maybe they should be.

Richard (Rick) Mills
[email protected]
www.aheadoftheherd.com

Permanent Gold Backwardation - When and how it will happen

February 11, 2012 1 comment

Permanent Gold Backwardation
By Keith Weiner

-
The Root of the Problem Is Debt

Worldwide, an incredible tower of debt has been under construction since President Nixon’s 1971 default on the gold obligations of the US government. His decree severed the redeemability of the dollar for gold and thus eliminated the extinguisher of debt. Debt has been growing exponentially everywhere since then. Debt is backed with debt, based on debt, dependent on debt and leveraged with yet more debt. For example, today it is possible to buy a bond (i.e., lend money) on margin (i.e., with borrowed money).

The time is now fast approaching when all debt will be defaulted on. In our perverse monetary system, one party’s debt is another’s “money.” A debtor’s default will impact the creditor (who is usually also a debtor to yet other creditors), causing him to default, and so on. When this begins in earnest, it will wipe out the banking system and thus everyone’s “money.” The paper currencies will not survive this. We are seeing the early edges of it now in the euro, and it’s anyone’s guess when it will happen in Japan, though it seems long overdue already. Last of all, it will come to the USA.

The purpose of this article is to present the early-warning signal and explain the actual mechanism to these events. Contrary to popular belief, it will not happen because the central banks increase the quantity of money to infinity. The money supply may even be contracting (which is what I expect).

To understand the terminal stages of the monetary system’s fatal disease, we must understand gold.

Defining Backwardation

First, let me introduce a key concept. Most traders define “backwardation” for a commodity as when the price of a futures contract is lower than the price of the same good in the spot market.

In every market, there are always two prices for a good: the bid and the ask. To sell a good, one must take the bid. And likewise, to buy the good, one must pay the ask. In backwardation, one can sell a physical good for cash and simultaneously buy a futures contract, and make a profit on the arbitrage. Note that in doing this trade, one’s position does not change in the end. One begins with a certain amount of the good and ends (upon maturity of the contract) with that same amount of the good.

Backwardation is when the bid in the spot market is greater than the ask in the futures market.

Many commodities, like wheat, are produced seasonally. But consumption is much more evenly spread around the year. Immediately prior to the harvest, the spot price of wheat is normally at its highest in relation to wheat futures. This is because wheat inventories in the warehouses are very low. People will have to pay a higher price for immediate delivery. At the same time, everyone in the market knows that the harvest is coming in one month. So the price, if a buyer can wait one month for delivery, is lower. This is a case of backwardation.

Backwardation is typically a signal of a shortage in a commodity. Anyone holding the commodity could make a risk-free profit by delivering it and getting it back later. If others put on this trade, and others, and so on, this would push down the bid in the spot market and lift up the ask in the futures market until the backwardation disappeared. The process of profiting from arbitrage compresses the spread one is arbitraging.

Actionable backwardations typically do not last long enough for the small trader to even see on the screen, much less trade. This is another way of saying that markets do not normally offer risk-free profits. In the case of wheat backwardation, for example, the backwardation may persist for weeks or longer. But there is no opportunity to profit for anyone, because no one has any wheat to spare. There is a genuine shortage of wheat before the harvest.

Why Gold Backwardation Is Important

Could backwardation happen with gold? Gold is not in shortage. One just has to measure abundance using the right metric. If you look at the inventories divided by annual mine production, the World Gold Council estimates this number to be around 80 years.

In all other commodities (except silver), inventories represent a few months of production. Other commodities can even have “gluts,” which usually lead to a price collapse. As an aside, this fact makes gold good for money. The price of gold does not decline, no matter how much of the stuff is produced. Production will certainly not lead to a “glut” in the gold market pulling prices downward.

So, what would a lower price on gold for future delivery mean compared to a higher price of gold in the spot market? By definition, it means that gold delivered to the market is in short supply.

The meaning of gold backwardation is that trust in future delivery is scarce.

In an ordinary commodity, scarcity of the physical good available for delivery today is resolved by higher prices. At a high enough price, demand for wheat falls until existing stocks are sufficient to meet the reduced demand.

But how is scarcity of trust resolved?

Thus far, the answer has been: via higher prices. Higher prices do coax some gold out of various hoards, jewelry, etc. Gold went into backwardation for the first time in December 2008. One could have earned a 2.5% (annualized) profit by selling physical gold and simultaneously buying a February 2009 future. Gold was $750 on December 5, but it rocketed to $920 - a gain of 23% - by the end of January.

But when backwardation becomes permanent, then trust in the gold futures market will have collapsed. Unlike with wheat, millions of people and many institutions have plenty of gold they can sell in the physical market and buy back via futures contracts. When they choose not to, that is the beginning of the end of the current financial system.

Why?

Think about the similarities between the following three statements:

  • “My paper gold future contract will be honored by delivery of gold.”
  • “If I trade my gold for paper now, I will be able to get gold back in the future.”
  • “I will be able to exchange paper money for gold in the future.”

The reason why there was a significant backwardation (smaller backwardations have occurred intermittently since then) is that people did not believe the first statement. They did not trust that the gold future would be honored in gold.

And if they don’t believe that paper futures will be honored in gold, then they have no reason to believe that they can get gold in the future at all.

If some gold owners still trust the system at that point, then they can sell their gold (at much higher prices, probably). But sooner or later, there will not be any sellers of gold in the physical market.

Higher Prices Can’t Cure Permanent Gold Backwardation

With an ordinary commodity, there is a limit to what buyers are willing to pay based on the need satisfied by that commodity, the availability of substitutes and the buyers’ other needs that also must be satisfied within the same budget. The higher the price, the more holders and producers are motivated to sell, and the less consumers are motivated (or able) to buy. The cure for high prices is high prices.

But gold is different. Unlike wheat, gold is not bought for consumption. While some people hold it to speculate on increases in its paper price, these speculators will be replaced by others who hold it because it is money.

Once the gold owners have lost confidence, no amount of price change will bring back trust in paper currencies. Gold will not have a “high enough” price that will discourage buying or encourage selling. Thus gold backwardation will not only recur, but at some point, it will stay in its backwardated state.

In looking at the bid and ask, one other observation is germane to this discussion. In times of crisis, it is always the bid that is withdrawn - there is never a lack of asks. Permanent gold backwardation can be seen as the withdrawal of bids denominated in gold for irredeemable government debt paper (e.g., dollar bills).

Backwardation should not be able to happen at all as gold is so abundant. However, the fact that it has happened and keeps happening means that it is inevitable and that, at some point, backwardation will become permanent. The erosion of faith in paper money is a one-way process (with some zigs and zags). But eventually, backwardation will become deeper and deeper (while the dollar price of gold is rising, probably exponentially).

The final step is when gold completely withdraws its bid on paper. At that point, paper’s bid on gold will be unlimited, and this is why paper will inevitably collapse without gold.

Conclusion

Permanent gold backwardation leading to the withdrawal of the gold bid on the dollar is the inevitable result of the debt collapse. Governments and other borrowers have long since passed the point where they can amortize their debts. Now they merely “roll” the debt and the interest as they come due. This leaves them vulnerable to the market demand for their bonds. When they have an auction that fails to attract bids, the game will be over. Whether they formally default or whether they just print the currency to pay, it won’t matter.

Gold owners, like everyone else, will watch this happen. If government bond holders sell their securities in response to this crisis, they will only receive paper backed by that same government and its bonds. But the gold owner has the power to withdraw his bid on paper altogether. When that happens, there will be an irreconcilable schism between gold and paper, with real goods and services taking the side of gold. And in a process that should play out within a few months once it gets started, paper money will no longer have any value.

Gold is not officially recognized as the foundation of the financial system. Yet it is still a necessary component. When it is withdrawn, the worldwide regime of irredeemable paper money will collapse.

Follow

Get every new post delivered to your Inbox.

Join 172 other followers