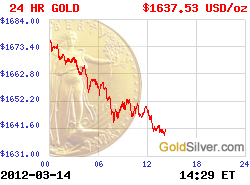
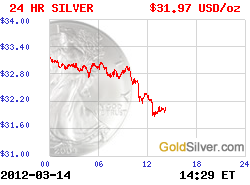
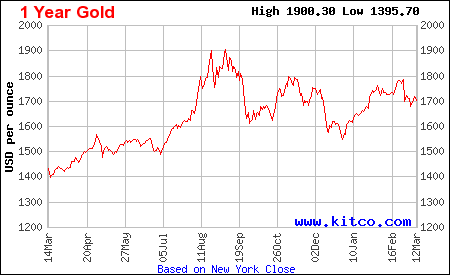
Silver Historical Charts

-
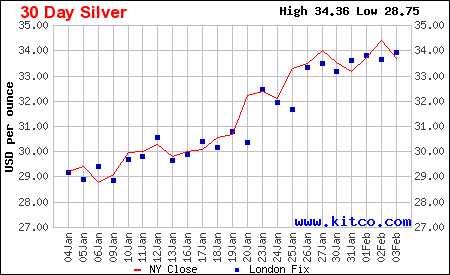
30 Day Silver

-

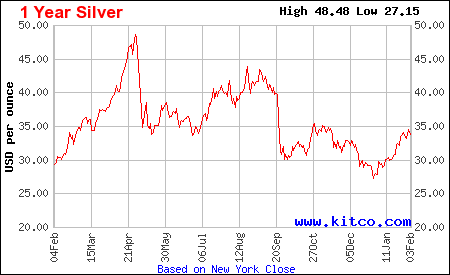
1 Year Silver

-

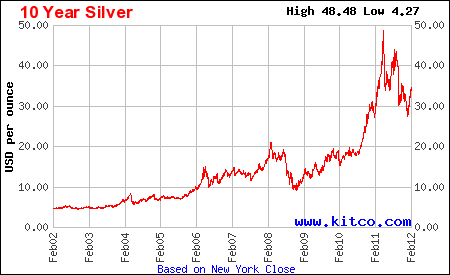
10 Year Silver

-

10 Year Silver

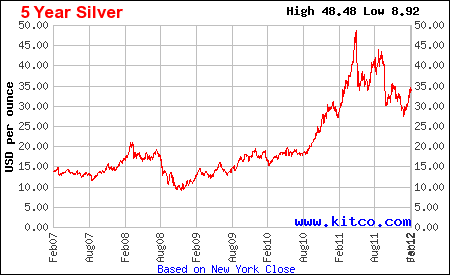
Historical Silver Charts by kitco.com

-

660-year silver (Blue Line) priced in 1998 dollars. Click to enlarge
Use this calculator to check specific points at today’s prices

660-year Silver Prices at 1998 Dollars.


Gold/Silver Ratio Historical Charts

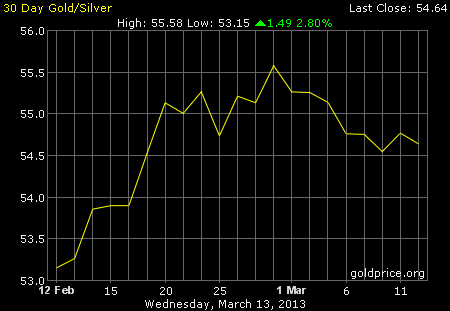
30-day Gold/Silver Ratio

-

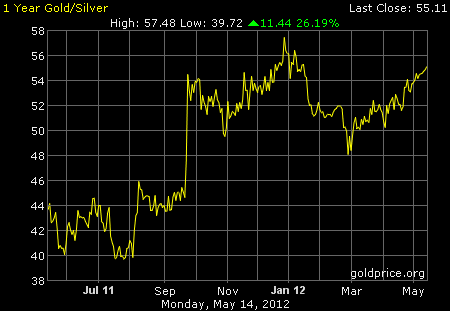
1-year Gold/Silver Ratio

-

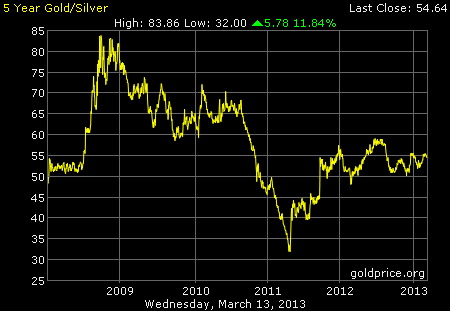
5-year Gold/Silver Ratio

-

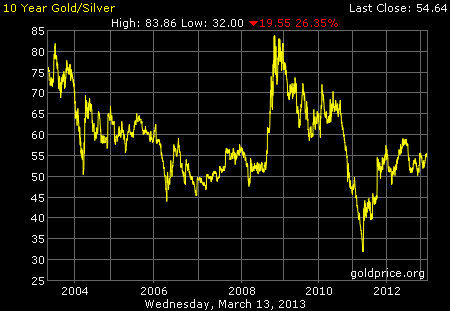
10-year Gold/Silver Ratio

Gold/Silver Ratio Charts by goldprice.org

660-year Gold/Silver Ratio. Click to enlarge
Yellow line is Gold/Silver ratio since 1334, showing a historic ratio of 16:1 for about 500 years

660-year Gold/Silver Ratio

  1. No comments yet.
  1. No trackbacks yet.

Leave a Reply

Fill in your details below or click an icon to log in:

WordPress.com Logo

You are commenting using your WordPress.com account. Log Out / Change )

Twitter picture

You are commenting using your Twitter account. Log Out / Change )

Facebook photo

You are commenting using your Facebook account. Log Out / Change )

Connecting to %s

Follow

Get every new post delivered to your Inbox.

Join 159 other followers