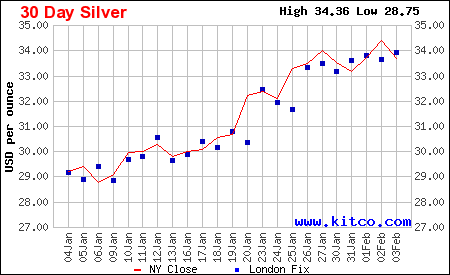
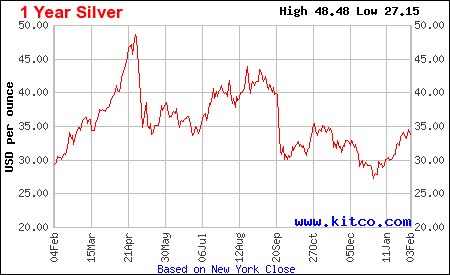
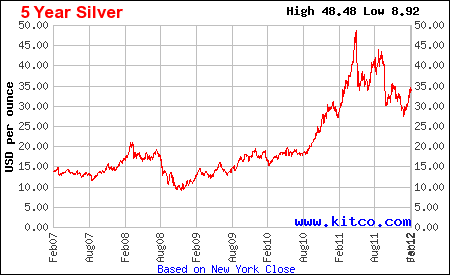
Silver Historical Charts
-
-
-
-
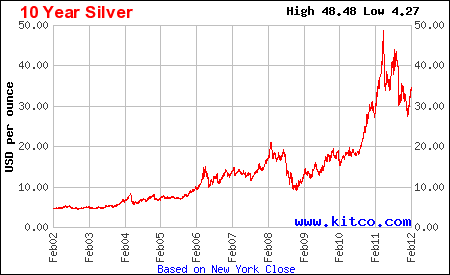
Historical Silver Charts by kitco.com
-
660-year silver (Blue Line) priced in 1998 dollars. Click to enlarge
Use this calculator to check specific points at today’s prices
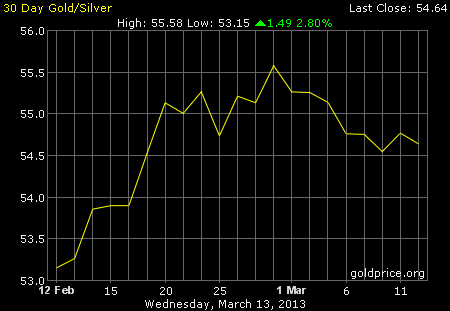
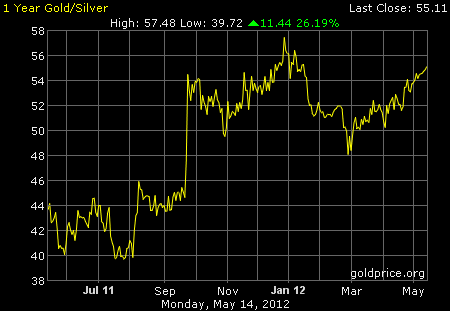
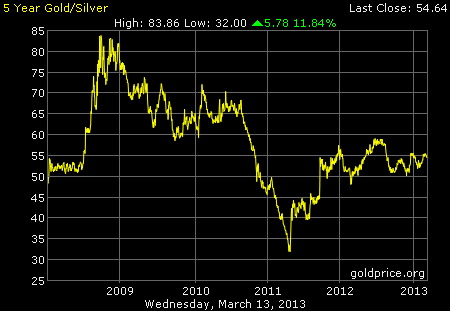
Gold/Silver Ratio Historical Charts
-
-
-
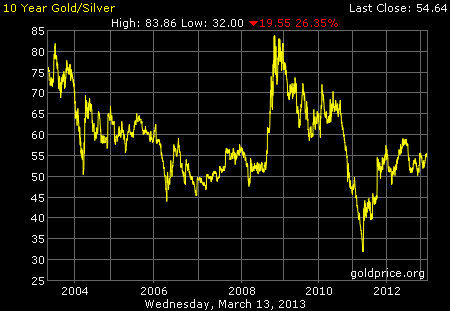
Gold/Silver Ratio Charts by goldprice.org
660-year Gold/Silver Ratio. Click to enlarge
Yellow line is Gold/Silver ratio since 1334, showing a historic ratio of 16:1 for about 500 years


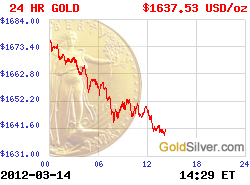
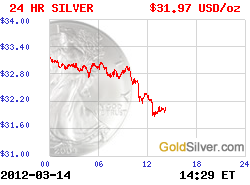
 More Charts: 1-Month, 1-Year, 5-Year, 10-Year