When to Exit Gold?
1. When the Gold/Silver ratio, Gold/Dow ratio and Mortgage/Rent ratio says it’s time.
Watch Mike Maloney’s video as he tackles the tough questions about today’s gold and silver cycle, where we are and where we are going. He explains why it does not help measuring the value of gold and silver in US$ when trying to decide when to exit gold (& silver).
-
-
Dow/Gold Ratio as at Dec 2011. It is still a long way from historical low of 1:1
-
2. When gold reaches the end of the mania phase
Take a look at the 3 phases of the bull market chart below. It’s time to think about exiting gold when it reaches the end of the mania phase, and that’s when lines begin to form in coin shops, everyone at the party talks about gold, your taxi driver and favourite shoe-shine man tells you they are buying gold.
Note that this is a generic chart for any financial asset going through a bull market, which is applicable so long as the common denominator against which its value is measured (global fiat currencies) remains relatively stable. This is not necessary true now, in view of the current monetary, financial & economic uncertainties. Considering the fact that gold itself is rapidly reclaiming its status as a monetary unit, the Blow Off phase may not play out as it normally does. If for example, there’s a structural change in the current monetary system and gold becomes (or plays a major role in) the denominator, then the chart will look very different going into the end of the mania phase. Learn about the different phases here.
-
3. When Real Interest Rates are consistently high and stable | Seeking Alpha
In the chart below, the shaded areas represent bull markets in gold. The line represents the real interest rate, as measured by one-year US Treasury yields minus one-year change in food prices.
When looking at the chart you’ll notice that gold bull markets are paired with volatile and low-to-negative real interest rates. Gold bear markets, on the other hand, occur when real interest rates are relatively stable and consistently positive. In fact, the end of the last secular bold bull market was triggered when real interest rates rose so high as to break the backs of the gold bulls.
Why does gold perform well when real interest rates are low/negative and volatile? Simply put, real interest rates represent the post-inflation returns bond investors receive on their holdings. Low real rates mean lower after-inflation returns on bonds, resulting in less of an opportunity cost for switching into other asset classes. Moreover, volatile real rates imply that market/economic forces are causing uncertainty in the Treasury market. During these periods, investors who want to preserve capital but aren’t willing to accept low/negative real returns are more likely to invest in gold.
If real interest rates truly are a measure of a gold market’s strength, it doesn’t look like the current secular bull market has met its end (as at Sep 2011).
4. When you see something like this at your magazine stand, it’s probably time to think about exiting gold.

Casey Research's edition of Time Magazine. Click for larger image ![]()


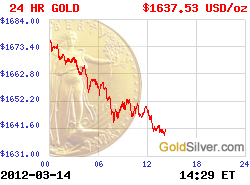
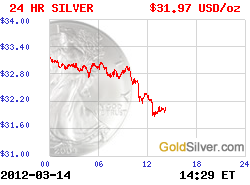
 More Charts: 1-Month, 1-Year, 5-Year, 10-Year
 More Charts: 1-Month, 1-Year, 5-Year, 10-Year
