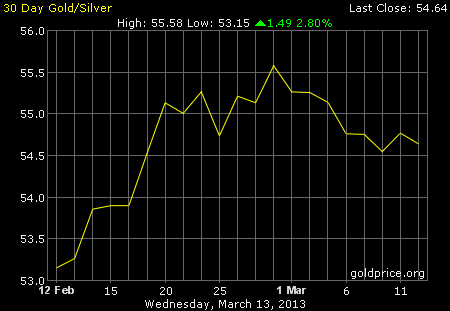
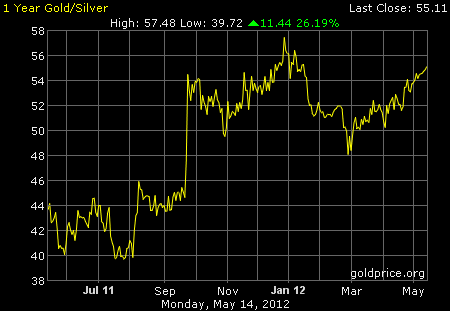
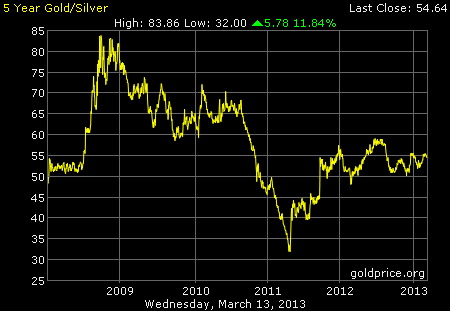
Gold/Silver Ratio Historical Charts
-
Gold/Silver Ratio Historical Charts
-
-
-
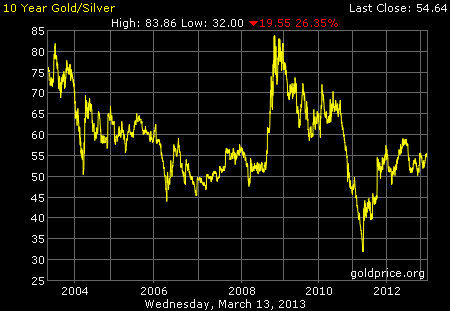
Gold/Silver Ratio Charts by goldprice.org
-
660-year Gold/Silver Ratio. Click to enlarge
Yellow line is Gold/Silver ratio since 1334, showing a historic ratio of 16:1 for about 500 years
Comments (0)
Trackbacks (0)
Leave a comment
Trackback
Leave a Reply
Featured Reviews


16Oct: Jeff Clark (Casey Research)
$2,300 gold by January 2014
05Sep: Bill Murphy (GATA)
$50 silver by year end
13Aug: James Turk (GoldMoney)
We won’t see $1580 gold & $27 silver again
12Aug: Bill Murphy's source
We could see a 100% increase in 90 days.
03Aug: HSBC Analysts
Gold to rally above $1,900 by end 2012
05June: David Bond (SilverMiners)
Gold & Silver may bottom at $1,200 & $18
02June: Don Coxe (Coxe Advisors)
Europe to issue Gold-backed Euro Bonds within the next 3 months
21May: Gene Arensberg (GotGoldReport)
Gold and Silver are very close to a bottom, if one has not already been put in last week
>> More forecasts & forecast accuracy
Daily GOLD US$/oz
Daily SILVER US$/oz

More Gold Charts: 1 Month to 660 Years

More Silver Charts: 1 Month to 660 Years

Gold/Silver Ratio: 1 Month to 660 Years
Gold & Silver Priced in BitCoins

Click to enlarge.
BitCoin donation welcomed.
1NQ4LqE8yL6rfAqikDU8wLhHSm5fntsWxk
 Gold & Silver Interviews (KWN)
- Here Is What Will Fuel The Move Higher In Hard Assets October 27, 2012
- Greyerz - Two Absolutely Incredible & Key Gold Charts October 26, 2012
- Celente - It’s Not Just Germany’s Gold That’s Missing October 26, 2012
- What To Expect With Gold Assaulting $1,700 & Silver At $32 October 26, 2012
- James Turk - The Entire German Gold Hoard Is Gone October 25, 2012
- KWN Update - Here Is A Huge Key To The Markets October 25, 2012
- Currency Wars Continue To Rage & This Is Positive For Gold October 25, 2012
- Central Planners Greatest Fear, Possible Surprises & Gold October 24, 2012
Finance & Economics
- Guest Post: GDP - The Warning Signs From Exports October 28, 2012 Tyler Durden
- On Europe And The Future Of International Relations October 28, 2012 Tyler Durden
- Meanwhile In Japan... October 27, 2012 Tyler Durden
- Bundesbank's Official Statment On Where It's Gold Is (And Isn't) October 27, 2012 Tyler Durden
- A CRuSTY CRiTTER AND aN INTeRPLaNeTaRY BuLL SHiTTeR... October 27, 2012 williambanzai7
- As Thousands Of Italians March Against Austerity On "No Monti Day", Berlusconi Threatens To Scuttle Monti Government October 27, 2012 Tyler Durden
- "Go South, Young Man": The Africa Scramble October 27, 2012 Tyler Durden
- Too Much Rain Will Kill Ya October 27, 2012 Bruce Krasting
