Permanent Gold Backwardation - When and how it will happen
Permanent Gold Backwardation
By Keith Weiner
-
The Root of the Problem Is Debt
Worldwide, an incredible tower of debt has been under construction since President Nixon’s 1971 default on the gold obligations of the US government. His decree severed the redeemability of the dollar for gold and thus eliminated the extinguisher of debt. Debt has been growing exponentially everywhere since then. Debt is backed with debt, based on debt, dependent on debt and leveraged with yet more debt. For example, today it is possible to buy a bond (i.e., lend money) on margin (i.e., with borrowed money).
The time is now fast approaching when all debt will be defaulted on. In our perverse monetary system, one party’s debt is another’s “money.” A debtor’s default will impact the creditor (who is usually also a debtor to yet other creditors), causing him to default, and so on. When this begins in earnest, it will wipe out the banking system and thus everyone’s “money.” The paper currencies will not survive this. We are seeing the early edges of it now in the euro, and it’s anyone’s guess when it will happen in Japan, though it seems long overdue already. Last of all, it will come to the USA.
The purpose of this article is to present the early-warning signal and explain the actual mechanism to these events. Contrary to popular belief, it will not happen because the central banks increase the quantity of money to infinity. The money supply may even be contracting (which is what I expect).
To understand the terminal stages of the monetary system’s fatal disease, we must understand gold.
Defining Backwardation
First, let me introduce a key concept. Most traders define “backwardation” for a commodity as when the price of a futures contract is lower than the price of the same good in the spot market.
In every market, there are always two prices for a good: the bid and the ask. To sell a good, one must take the bid. And likewise, to buy the good, one must pay the ask. In backwardation, one can sell a physical good for cash and simultaneously buy a futures contract, and make a profit on the arbitrage. Note that in doing this trade, one’s position does not change in the end. One begins with a certain amount of the good and ends (upon maturity of the contract) with that same amount of the good.
Backwardation is when the bid in the spot market is greater than the ask in the futures market.
Many commodities, like wheat, are produced seasonally. But consumption is much more evenly spread around the year. Immediately prior to the harvest, the spot price of wheat is normally at its highest in relation to wheat futures. This is because wheat inventories in the warehouses are very low. People will have to pay a higher price for immediate delivery. At the same time, everyone in the market knows that the harvest is coming in one month. So the price, if a buyer can wait one month for delivery, is lower. This is a case of backwardation.
Backwardation is typically a signal of a shortage in a commodity. Anyone holding the commodity could make a risk-free profit by delivering it and getting it back later. If others put on this trade, and others, and so on, this would push down the bid in the spot market and lift up the ask in the futures market until the backwardation disappeared. The process of profiting from arbitrage compresses the spread one is arbitraging.
Actionable backwardations typically do not last long enough for the small trader to even see on the screen, much less trade. This is another way of saying that markets do not normally offer risk-free profits. In the case of wheat backwardation, for example, the backwardation may persist for weeks or longer. But there is no opportunity to profit for anyone, because no one has any wheat to spare. There is a genuine shortage of wheat before the harvest.
Why Gold Backwardation Is Important
Could backwardation happen with gold? Gold is not in shortage. One just has to measure abundance using the right metric. If you look at the inventories divided by annual mine production, the World Gold Council estimates this number to be around 80 years.
In all other commodities (except silver), inventories represent a few months of production. Other commodities can even have “gluts,” which usually lead to a price collapse. As an aside, this fact makes gold good for money. The price of gold does not decline, no matter how much of the stuff is produced. Production will certainly not lead to a “glut” in the gold market pulling prices downward.
So, what would a lower price on gold for future delivery mean compared to a higher price of gold in the spot market? By definition, it means that gold delivered to the market is in short supply.
The meaning of gold backwardation is that trust in future delivery is scarce.
In an ordinary commodity, scarcity of the physical good available for delivery today is resolved by higher prices. At a high enough price, demand for wheat falls until existing stocks are sufficient to meet the reduced demand.
But how is scarcity of trust resolved?
Thus far, the answer has been: via higher prices. Higher prices do coax some gold out of various hoards, jewelry, etc. Gold went into backwardation for the first time in December 2008. One could have earned a 2.5% (annualized) profit by selling physical gold and simultaneously buying a February 2009 future. Gold was $750 on December 5, but it rocketed to $920 - a gain of 23% - by the end of January.
But when backwardation becomes permanent, then trust in the gold futures market will have collapsed. Unlike with wheat, millions of people and many institutions have plenty of gold they can sell in the physical market and buy back via futures contracts. When they choose not to, that is the beginning of the end of the current financial system.
Why?
Think about the similarities between the following three statements:
- “My paper gold future contract will be honored by delivery of gold.”
- “If I trade my gold for paper now, I will be able to get gold back in the future.”
- “I will be able to exchange paper money for gold in the future.”
The reason why there was a significant backwardation (smaller backwardations have occurred intermittently since then) is that people did not believe the first statement. They did not trust that the gold future would be honored in gold.
And if they don’t believe that paper futures will be honored in gold, then they have no reason to believe that they can get gold in the future at all.
If some gold owners still trust the system at that point, then they can sell their gold (at much higher prices, probably). But sooner or later, there will not be any sellers of gold in the physical market.
Higher Prices Can’t Cure Permanent Gold Backwardation
With an ordinary commodity, there is a limit to what buyers are willing to pay based on the need satisfied by that commodity, the availability of substitutes and the buyers’ other needs that also must be satisfied within the same budget. The higher the price, the more holders and producers are motivated to sell, and the less consumers are motivated (or able) to buy. The cure for high prices is high prices.
But gold is different. Unlike wheat, gold is not bought for consumption. While some people hold it to speculate on increases in its paper price, these speculators will be replaced by others who hold it because it is money.
Once the gold owners have lost confidence, no amount of price change will bring back trust in paper currencies. Gold will not have a “high enough” price that will discourage buying or encourage selling. Thus gold backwardation will not only recur, but at some point, it will stay in its backwardated state.
In looking at the bid and ask, one other observation is germane to this discussion. In times of crisis, it is always the bid that is withdrawn - there is never a lack of asks. Permanent gold backwardation can be seen as the withdrawal of bids denominated in gold for irredeemable government debt paper (e.g., dollar bills).
Backwardation should not be able to happen at all as gold is so abundant. However, the fact that it has happened and keeps happening means that it is inevitable and that, at some point, backwardation will become permanent. The erosion of faith in paper money is a one-way process (with some zigs and zags). But eventually, backwardation will become deeper and deeper (while the dollar price of gold is rising, probably exponentially).
The final step is when gold completely withdraws its bid on paper. At that point, paper’s bid on gold will be unlimited, and this is why paper will inevitably collapse without gold.
Conclusion
Permanent gold backwardation leading to the withdrawal of the gold bid on the dollar is the inevitable result of the debt collapse. Governments and other borrowers have long since passed the point where they can amortize their debts. Now they merely “roll” the debt and the interest as they come due. This leaves them vulnerable to the market demand for their bonds. When they have an auction that fails to attract bids, the game will be over. Whether they formally default or whether they just print the currency to pay, it won’t matter.
Gold owners, like everyone else, will watch this happen. If government bond holders sell their securities in response to this crisis, they will only receive paper backed by that same government and its bonds. But the gold owner has the power to withdraw his bid on paper altogether. When that happens, there will be an irreconcilable schism between gold and paper, with real goods and services taking the side of gold. And in a process that should play out within a few months once it gets started, paper money will no longer have any value.
Gold is not officially recognized as the foundation of the financial system. Yet it is still a necessary component. When it is withdrawn, the worldwide regime of irredeemable paper money will collapse.


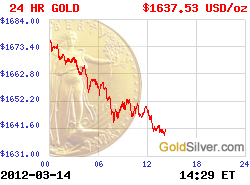
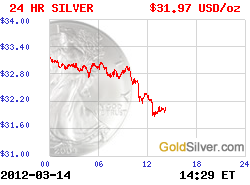
 More Charts: 1-Month, 1-Year, 5-Year, 10-Year
 More Charts: 1-Month, 1-Year, 5-Year, 10-Year

Recent Comments