Archive

Posts Tagged ‘USD’

Peaks and Troughs

February 6, 2012 Leave a comment
-
While I was travelling over the Andean mountains soaking in the majestic sceneries and virtually out of touch with the financial world for over 10 weeks, the PMs market seemed to be having its own mountain-valley experience.  Unknown to me, gold and silver took a 15 and 24 percent plunge respectively against the USD towards the end of the year. While they were down against most fiat currencies, it did not affect me, nor others who’ve saved and done their accounting in ounces of gold and silver. Not one bit. Neither did they do us much good when their USD prices soared 11% and 19% respectively in January. Life goes on while the powers that be continue to play their paper shenanigans.

For the benefit of readers who continue to do their accounting in units of fiat currencies, I’ve summarised the performance of gold and silver in several currencies through the charts below. Hope they help to put things into perspective.

-

Gold & silver performance relative to various currencies in 2011

In 2011, gold appreciated by an average of 14.3% against all 75 fiat currencies tracked by goldsilver.com, while silver averaged a corresponding loss of 6.8%. Among the selected currencies of interest charted above, only the Indian Rupee recorded a loss against both gold and silver.

-
Gold & silver performance over 12 years

Going back to the beginning of this secular bull market in PMs, both gold and silver charted impressive gains against all tracked currencies. If you’ve been earning or saving in Indian Rupees over the past 12 years, you’d have lost over 500% against both gold and silver. If you think the Indian Rupee had it bad, spare a thought for those who’ve saved in Iranian Rial or Argentinian Peso, which depreciated by 3,368% and 2,240% respectively against gold.


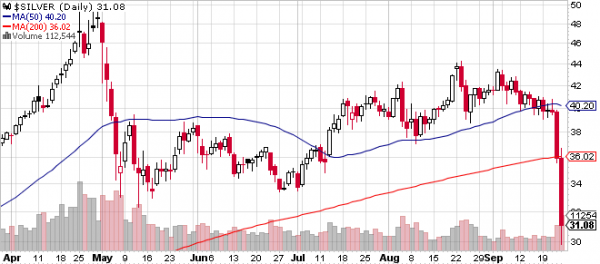
Gold & silver performance before April’s price take downs

Silver’s 2011 performance was extremely volatile peaking in late April.  Silver’s peak and subsequent drop in price mirrored what we witnessed in its 2008 price action when the silver spot price dropped 50% peak to trough intra-year. This chart shows how silver has been leading gold’s performance just before the April price take downs.

Be prepared!

If you’ve been following recent geo-political and macro-economics news, you’d be much better informed than me. Doing a quick review of what transpired during the period I left this blog idle, here’s what I consider noteworthy developments:

  • The Fed’s announcement of its zero-rate policy through 2014, requiring it to print more money to buy US Treasuries.
  • ECB engaging on its own campaign of printing money hoping to “solve” Euro zone’s deepening debt crisis.
  • Start of a countdown to the war with Iran.
  • MF Global’s $6.3 billion “repos” saga leading to its collapse and potentially bringing down the Futures/Options (and other derivatives) market along with it.

Bottom line is things are getting worse, not better (as the MSM would have you believe), especially for savers and retirees. 2012 and 2013 are setting themselves up to be potentially disruptive years. Be prepared!

Updates to static pages:

  • GoldMoney Review: Discontinued services, Gold & Silver “Client holdings by vaults” charts as at 30 Dec 2011
  • BullionVault Review: Gold & Silver  ”Client holdings by vaults” charts as at 30 Dec 2011
  • Compare AFE, BullionVault, GoldMoney: Comparative gold & silver holding charts as at 30 Dec 2011 and Alexa comparative traffic rank chart as at 01 Feb 2012.
  • Fees Comparison: Highlighting GoldMoney’s zero-spread trading advantage.
  • Forecasts: All close ended PMs price action forecasts by industry leaders were off target! New ones are being tracked.

-

On the lighter side…

Endemic to the Galápagos Islands, these bright golden land iguanas (Conolophus subcristatus) are incredible friendly and approachable. If not for the 2-meter rule, you could easily reach out to touch them!
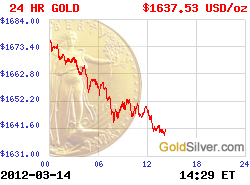
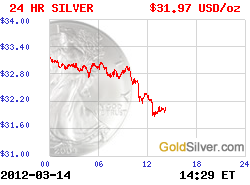
Decoded: Is there Any Gold in Fort Knox?

October 12, 2011 2 comments

-
In 1933, U.S. President Franklin D. Roosevelt outlawed the private ownership of gold by American citizens, forcing them to sell any gold bullion in excess of $100 to the Federal Reserve at $20.67 per troy ounce. To store the huge stockpile of confiscated gold, the US Treasury built the United States Bullion Depository at Fort Knox, Kentucky, in 1936. This vault has a 25″ thick casing with a 21″ vault door made of the latest torch and drill resistant material weighing 20 tons.

There must be something very valuable in there to justify this level of security.  Official records say there’s 4,577 metric tons (147.2 million oz. troy) of gold bullion worth over $200 billion at current prices. Of late however, there’s an increasing number of respectable people questioning the notion that the stated amount of gold is actually still there, and if so, that it remains unencumbered.

In this History Channel documentary Decoded, Brad Meltzer attempts to answer the question “Is there any gold in Fort Knox?”. Featuring interviews with notable figures like Chris Powell of GATA,  Law Professor Kevin Goldberg, Senator Dee Huddleston, former US Senator of Kentucky and many more, it’s an eye opener.

Part 1 “What if I told you that Fort Knox is empty.The last time anyone was allowed inside was in 1974. Many experts today believe the soilders stationed here are protecting absolutely nothing.They point to numerous theories to explain their believes.., but if you tell me that no one’s been allowed to see this gold since 1974, I want to know if it’s there and I want to know what else is inside. It is time to decode Fort Knox.”

-

Part 2 Craig Hulet, a returning veteran charged with issuing weapons to guards at Fort Knox was told by his Officer In Charge not to issue any ammunition because there was no gold inside. As for potential armed intruders - there’s a policy of “Let them in and zip them up”.A Financial Engineer from Princeton who spoke on condition of anonymity discusses the implications of an empty Fort Knox. He compares his work on financial derivatives at Wall Street to the Manhattan Project.

-

Part 3-

-

Is there Gold in Fort Knox?

-
Related Articles:

Credit where credit is due

September 24, 2011 9 comments

-

“When you own gold you’re fighting every central bank in the world”. Jim Rickards

To a great extend, that holds true for silver as well. This week, holders of Political Metals lost a battle, but certainly not the war. Measured against the USD, gold and silver are worth less compared to a week ago by 9.6% and 26.3% respectively.

It all started with Ben Bernanke’s statement, following the 2-day FOMC meeting, stating the obvious - that “there are significant downside risks to the economic outlook, including strains in global financial markets”. His antidote was a plan to purchase $400 billion of long-term Treasury bonds and to sell an equivalent amount of short-term debt. More commonly referred to as “Operation Twist 2″, this plan seeks to further reduce long term interest rates, after having pledged to hold short term rates practically at zero until 2013.

That announcement, made in the backdrop of the Eurozone debt crisis and news of slower growth in China, sent global stocks and commodity markets into a waterfall decline. This set up was ideal for the bullion banks who have massive gold and silver short positions. All they needed to do was to pull the trigger, and that’s exactly what they did on Thursday. Silver was pushed down sharply through its key 50 and 200 day moving averages, triggering an avalanche of tech funds selling the following day.

Going for the final kill of the week, news of yet another margin hike by CME (gold by 21%, silver by 16%) leaked into the market towards the end of Friday’s trading day. That further fuelled the selling, pushing silver briefly below $30 before closing at $31.08 - down 26.3% for the week.

In other markets this week, the Dow suffered its biggest loss since 2008. In four days U.S. stocks lost $1.1 trillion in value.  The MSCI all-country world share index (tracking thousands of stocks from developed and emerging countries) recorded its second worst quarter in 23 years and the 30-year bond rates dropped 55bps - the biggest move since the 1987 Black Monday.

So there you have it, Dr. Ben Bernanke, bullion banks & CME working together in perfect harmony. I don’t believe for a moment that the resulting market turmoil was any surprise to Bernanke. Despite saying that gold is not money, he’s smarter than most people made him out to be. After all, he achieved an SAT score of 1590 out of 1600, graduated from Harvard and has a PhD in economics from MIT. Contrary to its statutory mandate of foster maximum employment and price stability, this market turmoil I believe is a piece of precision engineering to achieve some larger agenda. This round is yours, congratulations Ben!

This engineered global markets take down could be part of the deflationary phase that Mike Maloney talked about, which is a prelude to the hyper-inflation phase. They have to assist the bullion banks cover their shorts and bring the Political Metals price down to a lower base before starting the next round of QE or equivalent. Marc Faber told ThomsonReuters that “if the S&P drops to around 900-950, we’ll get QE3 for sure”.

Four ways to view the developments over the past week

If you’re reading this blog, you’re not a professional or a day trader, possibly someone already invested in gold or silver, someone holding some Political Metals (I distinguish between investing & holding here) or someone in the process of researching the matter. As non professional traders, we have to look through and not at the turmoil unfolding before us. All of the bloody carnage above are on “paper” or bits on silicon - illusionary financial derivatives of something tangible (like gold and silver) or derivatives of something totally virtual and non-physical (like interest rates, bonds, debts, CDS, etc). Real or imaginary, they are all derivatives backed by nothing more than a promise or lies of a third party.

Unfortunately, in so far as gold & silver is concerned, the outcome of the imaginary paper price wars above gets applied to the physical world. Price discovery currently comes from the paper derivatives market. Banks and multi billion dollar hedge funds throwing thousands of futures contracts or bets at each other (most of which are done through computerised High Frequency Trading algorithms) determine the price of the coin or bar you pick up at your local bullion dealers. Until such time when this absurd situation of the tail wagging the dog changes, I suggest 4 possible ways for you to view the developments over the past week, using silver as an example.


There’s a big difference between Investing(1) & Holding(2). If you adopt approach (1), and are smart enough to handle scenario (3), congratulations! Trading this dip or swapping silver for gold just before the GSR shot over 56 would have reaped a handsome return. After years of following newsletter writers, both paid and free, I came to the conclusion that attempting to achieve (3) is at best illusionary, and at worst risky. This is particularly true in a manipulated market. Take a look at some of the forecasts by well respected industry players here. Either they missed this week’s price action or are not telling us something. Richard Russell puts it this way:

I look at gold and silver, not as a play for profits, but as an accumulation of hard assets, in a world that it drowning in fiat money, and a world that will probably print trillions more of irredeemable paper.

Finally, if you’ve been waiting patiently (4) or have spare dry powder, congratulations! While the paper price of gold & silver gets whacked, physical demand is very strong. KWN reported that Sprott Money temporarily runs out of physical silver. So, get ready to pick up your discount. Not necessarily immediately, but then again, picking the absolute bottom can also be illusionary. Best industry advise is cost averaging.

Updated:

-