Archive

Posts Tagged ‘QE’

Silver Eagles Soar

February 18, 2012 Leave a comment

Submitted by: Richard (Rick) Mills | Ahead of the Herd

-

As a general rule, the most successful man in life is the man who has the best information

In World War I severe material shortages played havoc with production schedules and caused lengthy delays in implementing programs. This led to development of the Harbord List – a list of 42 materials deemed critical to the military.

After World War II the United States created the National Defense Stockpile (NDS) to acquire and store critical strategic materials for national defense purposes. The Defense Logistics Agency Strategic Materials (DLA Strategic Materials) oversees operations of the NDS and their primary mission is to “protect the nation against a dangerous and costly dependence upon foreign sources of supply for critical materials in times of national emergency.”

The NDS was intended for all essential civilian and military uses in times of emergencies. In 1992, Congress directed that the bulk of these stored commodities be sold. Revenues from the sales went to the Treasury General Fund and a variety of defense programs - the Foreign Military Sales program, military personnel benefits, and the buyback of broadband frequencies for military use.

American Silver Eagle

The American Silver Eagle is the official silver bullion coin of the United States. It was first released by the United States Mint on November 24, 1986 and is struck only in the one troy ounce size.

American Silver EagleThe Bullion American Silver Eagle sales program ultimately came about because the US government wanted, during the 1970s and early 1980s, to sell off what it considered excess silver from the Defense National Stockpile.

“Several administrations had sought unsuccessfully to sell silver from the stockpile, arguing that domestic production of silver far exceeds strategic needs. But mining-state interests had opposed any sale, as had pro-military legislators who wanted assurances that the proceeds would be used to buy materials more urgently needed for the stockpile rather than merely to reduce the federal deficit.” Wall Street Journal

The authorizing legislation for the American Silver Eagle bullion sales program required that the silver used for the coins had to be from the Defense National Stockpile. By 2002 the DNS stockpile was so depleted of silver that if the American Silver Eagle bullion sales program was to continue further legislation was required.

On June 6, 2002, Senator Harry Reid (D-Nevada) introduced the Support of American Eagle Silver Bullion Program Act to “authorize the Secretary of the Treasury to purchase silver on the open market when the silver stockpile is depleted.”

2002 - 10,539,026 Bullion American Silver Eagles were sold.

2003 - 8,495,008 Bullion American Silver Eagles were sold, silver averaged $4.88 an ounce for the year.

2004 - 8,882,754 Bullion American Silver Eagles were sold. For 2004 the average cost of an ounce of silver was $6.67.

2005 - 8,891,025 Bullion American Silver Eagles were sold. Silver averaged $7.32 an ounce.

2006 - 10,676,522 Bullion American Silver Eagles were sold. Silver averaged $11.55 an ounce

2007 - 9,028,036 Bullion American Silver Eagles were sold.

2008 - 20,583,000 Bullion American Silver Eagles were sold. Silver averaged $14.99 an ounce and almost 80% more Bullion American Silver Eagles were sold then in any previous year.

The US Mint suspended sales of the silver bullion coins to its network of authorized purchasers twice during the year.

In March 2008, sales increased nine times over the month before - 200,000 to 1,855,000.

In April 2008, the United States Mint had to start an allocation program, effectively rationing Silver Eagle bullion coins to authorized dealers on a weekly basis due to “unprecedented demand.”

On June 6, 2008, the Mint announced that all incoming silver planchets were being used to produce only bullion issues of the Silver Eagle and not proof or uncirculated collectible issues.

The 2008 Proof Silver Eagle became unavailable for purchase from the United States Mint in August 2008.

2009 - 30,459,000 Bullion American Silver Eagles were sold

On March 5, 2009, the United States Mint announced that the proof and uncirculated versions of the Silver Eagle coin for that year were temporarily suspended due to continuing high demand for the bullion version.

On October 6, 2009, the Mint announced that the collectible versions of the Silver Eagle coin would not be produced for 2009.

The sale of 2009 Silver Eagle bullion coins was suspended from November 24 to December 6 and the allocation program was re-instituted on December 7.

Silver Eagle bullion coins sold out on January 12, 2010.

The average cost of an ounce of silver in 2009 was $14.67

2010

No proof Silver Eagles were released through the first ten months of the year, and there was a complete cancellation of the uncirculated Silver Eagles.

Production of the 2010 Silver Eagle bullion coins began in January instead of  December as usual. The coins were distributed to authorized dealers under an allocation program until September 3.

In 2010 the US Mint sold 34,700,000 Bullion American Silver Eagle Coins.

2011

According to the USGS’s most recent Silver Mineral Industry Survey, silver production fell to 37 tonnes in October - compared to 53 tonnes year over year (yoy).

In 2011, the United States produced approximately 1,054 tonnes of silver – down from 2010’s production of 1,154 tonnes and down from 2007’s production of 1,163 tonnes.

Silver ChartThe US imported 6,600,000 oz of silver for consumption in 2011 – up from 2007’s imports of 4,830,000 oz.

In 2011 the US Mint sold 39,868,500 Bullion American Silver Eagle Coins.

2011 was the first year in which official coin sales will surpass domestic silver production.

Jeff Clark of Casey Research writes“For the first time in history, sales of silver Eagle and Maple Leaf coins surpassed domestic production in both the US and Canada. Throw in the fact that by most estimates less than 5% of the US population owns any gold or silver and you can see how precarious the situation is. A supply squeeze is not out of the question – rather it is coming to look more and more likely with each passing month.”

The US Mint is required by law to mint the bullion Silver Eagles to meet public demand for precious metal coins as an investment option. The numismatic versions of the coin (proof and uncirculated) were added by the Mint solely for collectors.

2012

United States Mint Authorized Purchasers (AP’s) ordered 3,197,000 Bullion American Silver Eagle Coins on January 3rd, the first day they went on sale. That opening day total catapulted January Bullion Eagle sales higher than half of the monthly totals in 2011.

As of January 25th 2012, 5,547,000 Bullion American Silver Eagle Coins had been sold.

Bullion Silver Eagles are guaranteed for weight and purity by the government of the United States and because of this the US government allows bullion Silver Eagles to be added to Individual Retirement Accounts (IRAs).

Conclusion

The twin policies of zero interest rates and the continual creation of money and credit being enacted today, by all governments and central banks, means that the purchase of precious metals is the only way to protect the value of your assets.

“Mark my words, if the interest rates on U.S. government debt truly reflected both the real level of inflation in this country and the rising risk of some form of default, rates would already by sky-high and the U.S. would resemble a massive Greece.”  John Embry, Chief Investment Strategist, Sprott Asset Management

Investors are currently risk adverse and mining stocks are not well understood by the general investing public, but at least one thing is going to become very apparent to most -  the best way to hedge yourself against inflation could be owning silver.

Junior resource companies offer the greatest leverage to increasing demand and rising prices for silver. Junior resource companies are soon going to have their turn under the investment spotlight and should be on every investors radar screen. Are they on yours?

If not, maybe they should be.

Richard (Rick) Mills
[email protected]
www.aheadoftheherd.com

Credit where credit is due

September 24, 2011 9 comments

-

“When you own gold you’re fighting every central bank in the world”. Jim Rickards

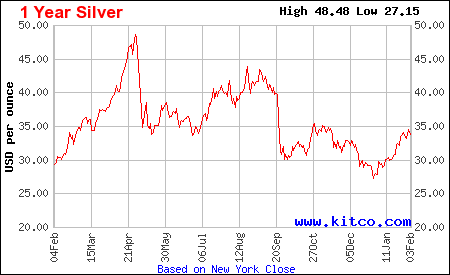
To a great extend, that holds true for silver as well. This week, holders of Political Metals lost a battle, but certainly not the war. Measured against the USD, gold and silver are worth less compared to a week ago by 9.6% and 26.3% respectively.

It all started with Ben Bernanke’s statement, following the 2-day FOMC meeting, stating the obvious - that “there are significant downside risks to the economic outlook, including strains in global financial markets”. His antidote was a plan to purchase $400 billion of long-term Treasury bonds and to sell an equivalent amount of short-term debt. More commonly referred to as “Operation Twist 2″, this plan seeks to further reduce long term interest rates, after having pledged to hold short term rates practically at zero until 2013.

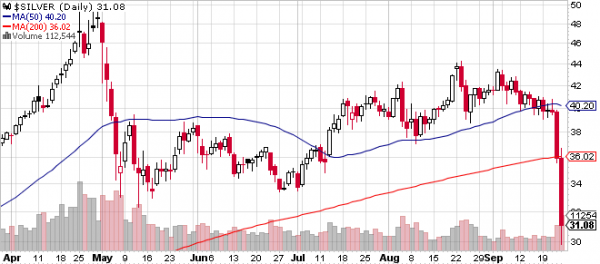
That announcement, made in the backdrop of the Eurozone debt crisis and news of slower growth in China, sent global stocks and commodity markets into a waterfall decline. This set up was ideal for the bullion banks who have massive gold and silver short positions. All they needed to do was to pull the trigger, and that’s exactly what they did on Thursday. Silver was pushed down sharply through its key 50 and 200 day moving averages, triggering an avalanche of tech funds selling the following day.

Going for the final kill of the week, news of yet another margin hike by CME (gold by 21%, silver by 16%) leaked into the market towards the end of Friday’s trading day. That further fuelled the selling, pushing silver briefly below $30 before closing at $31.08 - down 26.3% for the week.

In other markets this week, the Dow suffered its biggest loss since 2008. In four days U.S. stocks lost $1.1 trillion in value.  The MSCI all-country world share index (tracking thousands of stocks from developed and emerging countries) recorded its second worst quarter in 23 years and the 30-year bond rates dropped 55bps - the biggest move since the 1987 Black Monday.

So there you have it, Dr. Ben Bernanke, bullion banks & CME working together in perfect harmony. I don’t believe for a moment that the resulting market turmoil was any surprise to Bernanke. Despite saying that gold is not money, he’s smarter than most people made him out to be. After all, he achieved an SAT score of 1590 out of 1600, graduated from Harvard and has a PhD in economics from MIT. Contrary to its statutory mandate of foster maximum employment and price stability, this market turmoil I believe is a piece of precision engineering to achieve some larger agenda. This round is yours, congratulations Ben!

This engineered global markets take down could be part of the deflationary phase that Mike Maloney talked about, which is a prelude to the hyper-inflation phase. They have to assist the bullion banks cover their shorts and bring the Political Metals price down to a lower base before starting the next round of QE or equivalent. Marc Faber told ThomsonReuters that “if the S&P drops to around 900-950, we’ll get QE3 for sure”.

Four ways to view the developments over the past week

If you’re reading this blog, you’re not a professional or a day trader, possibly someone already invested in gold or silver, someone holding some Political Metals (I distinguish between investing & holding here) or someone in the process of researching the matter. As non professional traders, we have to look through and not at the turmoil unfolding before us. All of the bloody carnage above are on “paper” or bits on silicon - illusionary financial derivatives of something tangible (like gold and silver) or derivatives of something totally virtual and non-physical (like interest rates, bonds, debts, CDS, etc). Real or imaginary, they are all derivatives backed by nothing more than a promise or lies of a third party.

Unfortunately, in so far as gold & silver is concerned, the outcome of the imaginary paper price wars above gets applied to the physical world. Price discovery currently comes from the paper derivatives market. Banks and multi billion dollar hedge funds throwing thousands of futures contracts or bets at each other (most of which are done through computerised High Frequency Trading algorithms) determine the price of the coin or bar you pick up at your local bullion dealers. Until such time when this absurd situation of the tail wagging the dog changes, I suggest 4 possible ways for you to view the developments over the past week, using silver as an example.


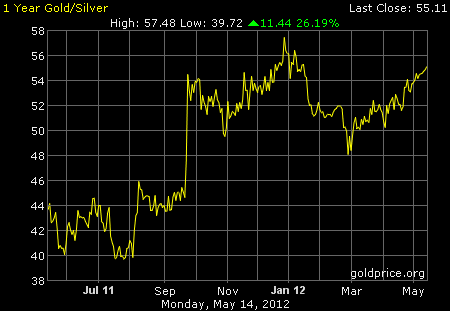
There’s a big difference between Investing(1) & Holding(2). If you adopt approach (1), and are smart enough to handle scenario (3), congratulations! Trading this dip or swapping silver for gold just before the GSR shot over 56 would have reaped a handsome return. After years of following newsletter writers, both paid and free, I came to the conclusion that attempting to achieve (3) is at best illusionary, and at worst risky. This is particularly true in a manipulated market. Take a look at some of the forecasts by well respected industry players here. Either they missed this week’s price action or are not telling us something. Richard Russell puts it this way:

I look at gold and silver, not as a play for profits, but as an accumulation of hard assets, in a world that it drowning in fiat money, and a world that will probably print trillions more of irredeemable paper.

Finally, if you’ve been waiting patiently (4) or have spare dry powder, congratulations! While the paper price of gold & silver gets whacked, physical demand is very strong. KWN reported that Sprott Money temporarily runs out of physical silver. So, get ready to pick up your discount. Not necessarily immediately, but then again, picking the absolute bottom can also be illusionary. Best industry advise is cost averaging.

Updated:

-

Why $20,000 Gold doesn’t excite me

August 24, 2011 3 comments

-

It scares me!

Gold punched through $1,900 today. If the current financial system can withstand the stress and remained intact till the day gold trades at $20,000 an ounce, what will life be like then?

If we’re holding gold at that time, we may be doing fine but we are not likely to be 10 times richer. That’s because nothing much has happened to our gold. Rather, paper currencies would have lost so much purchasing power that it would take 10 times more of the same to buy what we could buy today. A Big Mac will most likely cost around $43 in the US. In Malaysia, NZ and Britain, it’ll like be  around RM76NZ$54 and £25 respectively (estimates based on Big Mac Index). When a basic meal costs that much, life can be very tough for savers who continued holding on to their paper currencies or other paper assets.

Many of my friends and relatives, from retired professionals to missionaries have been ill advised to rely on supposedly safe or high yielding investments like mutual funds, government managed pension schemes, term deposits or hot stocks to generate passive income or preserve the value of their retirement funds. Despite being presented with information from this website and elsewhere, there’s little affinity shown towards gold or silver. This scares me and for their sake, I hope gold does not get anywhere close to $20,000 before they get on board.

What’s even scarier is the fact that an enormously huge segment of society do not have the means to get on board, even if they wanted to. We’re looking at the 1.4 billion people living on less than NZ$2.25 a day. That’s less than 0.05 ounces of silver! They worry not about the Fed nor the Cartel but about how to provide food, clothing, housing and healthcare with that amount each day. It’s about survival, not savings. Pause for a moment to imagine their plight when gold hits $20,000.  Spare them a thought today, and check out their appeal for assistance.

Why $20,000 gold?

In this recently released documentary, Mike Maloney presents the case for $20,000 gold by stepping back and looking at the big picture. He takes us back, very far back, and paints us a very big picture. This excellent educational video is a must watch, especially if you’re new to the Political Metals space. It’ll be your 90 minutes well spent.

But if you can’t spare the time, I’ve highlighted some of his key points with some new charts below for a quick read.

-

Dow/Gold Ratio Chart: Where are we in the Wealth Cycle? 

Using the Dow Jones Industrial Average (Dow) as a measure of performance of the equities market in general, the ratio of the Dow to the price of gold indicates the performance of equities market relative to gold. Currently each point of the Dow is worth about 6oz of gold. During the process of correction after the biggest stock market bubble in history, the ratio is expected to head towards the historical mean (4oz) and overshoot it before finding its fair value again.

The bigger the bubble (deviation from mean), the larger the overshoot. During the present cycle, Mike expects the overshoot to touch 0.5:1 (1 oz of gold worth 2 points of Dow). In its extreme, the Dow would have to collapse from 11,000 to 950 if the price of gold remains at current level of $1,900. Conversely, gold will increase to $22,000 if the Dow remains at current levels.

Relative performance of Dow Vs Gold & Silver since Jan 2000
(Worst reference point, at peak of stock market bubble)

Relative performance of Dow Vs Gold & Silver since March 2009
(Best reference point, at the start of QE1)

-

Currency Supply Chart: Where are we in the Inflation/Deflation Cycle?

For simplicity, “money” & “currency” are used interchangeably here. Watch the video to see the difference.

Monetary inflation is the increase in money supply resulting in price inflation (rising prices of goods & services), with a time lag between the former and the latter. The reverse applies to monetary deflation and price deflation. Studying the trend in money supply or the total amount of currency in circulation (CinC) over a period of time gives us an idea of where we are and where we’re heading in terms of inflation and deflation.

Money is created in two stages. The initial Base Money is created by the Fed (or other central banks). More new money is then created (up to 9 times the initial Base Money) within the private banking system through credit. It is loaned into existence. Watch the video to learn more about the money creation process.

The chart above  represents the amount of CinC that’s exclusively created by the private banking system. The highlighted area indicates that this component of the overall money supply has dropped by $1.7T since the 2008 crisis. This is the Debt Collapse or Credit Contraction. Less lending by banks results in less money chasing goods and services, leading to price & asset deflation. It is evident from the chart that a contraction of this magnitude has never happened since 1960. The last time it happened was just before the Great Depression of the 1930s.

M1: Increase in Base MoneyIn response to this credit contraction, and in an attempt to prevent another Great Depression, the Fed has been rapidly increasing the Base Money supply by creating new money. The recent rate of increase is unprecedented. The first trillion dollars was created over a period of about 90 years. The next $1.4T came into existence over the last 2 years!

This rapid increase in Base Money (red chart) was an attempt to offset the decrease in the credit money (blue chart). When we add these two components of money supply together, we obtain the total CinC (Base Money plus Credit Money) as shown in the chart below.

Notice the contraction at the top of the chart, albeit a smaller one. It is evident that despite the frantic pace of money printing by the Fed, it has not succeeded in offsetting the reduction in money supply due to credit contraction.

The Fed has little choice but to continue creating money.  With such a large perturbation in total currency supply and due to the complexity and size of the monetary system, it is not possible for the Fed or anyone else to create just sufficient money at just the right rate such that the total CinC won’t overshoot its long term trend. The principle that the larger the deviation from the mean, the larger will be the overshoot during the correction applies here as in the stock market above. The fact that there’s an undetermined time lag, between monetary inflation and price inflation further adds to the likelihood that the next round of money printing will result in a massive overshoot. Coupled with other factors, hyperinflation could be just round the corner.

Deflation or Inflation?

In his book, Rich Dad’s Advisors: Guide to Investing In Gold and Silver: Protect Your Financial Future, and again in his presentation, Mike predicted the following sequence of events:-

  1. Threat of deflation - At the onset of the 2008 crisis (Past)
  2. Money printing - TARP, QE1, QE2 (Past & more to come)
  3. Big inflation - Here and now (anyone disagree?)
  4. Real deflation - Asset deflation in real estate & stock market (The severe but short deflation  is ahead)
  5. Hyperinflation - Just round the corner?

How does gold perform under inflation and deflation environment? Check out the study by Oxford Economics: “Impact of inflation and deflation on the case for gold”.

Related Resources:

-

Gold cartel is finally losing control.

August 14, 2011 Leave a comment

-

This enlightening discussion between James Turk (GoldMoney) and John Embry (Sprott Asset Management) touches on various significant developments in the gold market in recent past. They talked about the S&P downgrade, QE to infinity, hyperinflation, Jim Sinclair’s $1764 inflection point and looking at the value of gold rather than its price.

They concluded that by looking at the past & present central banks’ role and dynamics of Asian demand, physical gold is now taking the lead in price discovery instead of paper gold.

The Gold cartel is losing control and the era of the tail wagging the dog may soon be over!

-

Euro Price of Gold Hits Third Record in Three Days

May 26, 2011 Leave a comment

London Gold Market Report
from Ben Traynor | BullionVault
Wednesday 25 May, 08:00 EDT

Euro Price of Gold Hits Third Record in Three Days as ECB “Basically Trapped” by “Horror Scenario” of Greek Default

U.S. DOLLAR gold prices rose to a three-week high of $1528 an ounce Wednesday morning London time, while commodity markets – like global stock markets – failed to add significantly to the gains they made Tuesday after Goldman Sachs issued a bullish note on the sector.

The London Fix on Wednesday morning saw Sterling gold prices set at £942, two pounds below Tuesday afternoon’s new all-time record.

Euro gold prices hit another new record – the third in three days – at €1084 an ounce.

“If we restructure Greek debt, that means Greece defaults,” said Christian Noyer, governor of the Banque de France and a member of the European Central Bank’s governing council, to journalists in Paris on Tuesday, describing the idea of Greek restructuring as a “horror scenario”.

The Greek government was forced on Wednesday to deny rumors that it was about to call a snap election.

If Greek debt were restructured, the ECB would no longer be able to accept Greek government bonds as collateral for loans, warned Juergen Stark – another executive board member – last week.

“They are now like many people in the banking system in calling out for no debt repudiation because they are so exposed,” says Charles Wyplosz, professor of International Economics at the Graduate Institute in Geneva, quoted by the Financial Times.

“The ECB is basically trapped,” says Wyplosz, as it has bought a large amount of Greek government debt through its asset purchase program.

“There is so much uncertainty [in the Eurozone] that the downside risk for gold prices is low in the short term,” says Andrey Kryuchenkov, London-based analyst at VTB Capital.

“People are still frightened about Portugal and about a possible restructuring of the Greek debt, so safe-haven flows will continue.”

Also in Paris, French finance minister Christine Lagarde – who in February pledged that other Eurozone members “won’t abandon Greece” – officially announced her candidacy to become the next managing director of the International Monetary Fund (IMF) on Wednesday.

“It is an immense challenge which I approach with humility and in the hope of achieving the broadest possible consensus,” said Lagarde.

But IMF executive directors from the BRICS countries – Brazil, Russia, India, China and South Africa – issued a joint statement Tuesday criticizing the “obsolete convention” that the head of what’s often called “the central banks’ central bank” should be a European.

Away from the Eurozone crisis, Goldman Sachs – which last month warned that “demand destruction” could see commodity prices fall – appeared to do a volte face on Tuesday, when it raised its price forecasts for the sector.

“We continue to expect that economic growth will likely be enough to tighten key supply-constrained markets,” it said in a report.

“We expect gold prices to continue to climb in 2011 as the resumption of quantitative easing should keep US real interest rates low.”

“Silver [also] appears to be making a tentative recovery,” says one London bullion dealer, who expects silver prices to hit resistance around $39.

Axel Rudolph and Karen Jones, technical analysts at Commerzbank, agree, predicting resistance at Silver’s 55-day moving average of $38.95.

Silver prices today gained over 2% to climb above $37 an ounce.

Goldman Sachs’ note predicted real interest rates would begin to rise in 2012, “likely causing gold prices to peak”. But “even if we remove some accommodation, policy will still be very easy,” Federal Reserve Bank of St Louis president James Bullard said earlier this week.

The Fed’s $600 billion asset purchasing program – widely known as QE2 – is due to end next month.

“We still have a considerable way to go to meet the Fed’s dual mandate of full employment and price stability,” said New York Fed president William Dudley last week, while Chicago Fed president Charles Evans has said monetary accommodation ought to remain “substantial”.

Ben Traynor
BullionVault

Adjusted For Inflation, Dollar Hits Fiat-Era Low

April 29, 2011 Leave a comment

By: John Melloy | CNBC

A trade-weighted measure of the U.S. dollar against a broad basket of currencies that includes the Yen, Euro and China’s Yuan is at a post-gold standard low when adjusted for inflation, according to calculations by Deutsche Bank’s economic team. The milestone could be viewed as a failure of the country’s monetary and fiscal policies upon which all paper – or fiat – currencies are based.
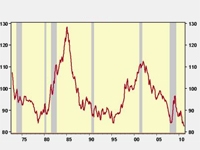
The Broad Trade-Weighted Dollar Index, which was created by the Federal Reserve, differs from the more popular “Dollar Index” because it includes a larger group of currencies and is weighted based on foreign trade. The stellar economics team at Deutsche Bank, led by Joe Lavorgna, then adjusts this measure for inflation to get what they believe to be the true measure of the dollar’s value in the world.

“In our risk scenario, little progress on the fiscal front raises the probability of a fiscal crisis and the odds that the Fed becomes the buyer of the last resort,” said David Woo, currency strategist for Bank of America Merrill Lynch, in a note to clients today. “This would accelerate the process of the USD’s demise as the global reserve currency and cause it to decline in a disorderly manner.”

The dollar hit new 2011 lows versus the Euro and the British Pound Thursday as traders increasingly viewed Federal Reserve Chairman Ben Bernanke’s monetary policy press conference a day before as dovish on inflation.

Deutsche Bank: Real broad trade-weighted exchange value of the US Dollar, March 73 = 100.

The Fed described the economy as recovering at a “moderate pace” in its statement, a dovish downgrade from the “firmer” recovery it stated before. The Fed also kept the language that it would remain accommodative for an “extended” period. In his first monetary policy press conference, Bernanke made no hints that his ongoing purchases of $600 billion in Treasury securities would be ended earlier than their June expiration date.

“QE2 has artificially reduced the risk premium of U.S. government bonds to below the level necessary to compensate investors for the worsened U.S. fiscal position,” added Woo.

Gold settled at a record for a 12th time this month on Thursday and is now up 31 percent from a year ago on concern that Bernanke has lost control over inflation. Silver is inches away from its 1980 record and is up 150 percent in the last 12 months.

“The recent parabolic spike in silver and to a lesser degree gold, shows that the market considers a ‘disorderly decline’ of the U.S. dollar an increasing possibility,” said

Jim Iuorio, managing director at TJM Institutional Services. “Devaluing your currency has always been a risky proposition and its success is dependant on knowing how to exit gracefully from monetary stimulus.”

The dollar was convertible into gold until the early 1970s, when President Nixon ended that agreement. Soon after, as the major currencies went from fixed rates to floating, the U.S. dollar established itself as the world’s reserve currency because of its economy’s size and relative strength. Floating, paper currencies are only worth what others deem them to be and the country’s central bank can print as much, or as little, of it as it wants.

“Devaluing your currency has always been a risky proposition and its success is dependant on knowing how to exit gracefully from monetary stimulus.”

Jim Iurio, Managing Director, TJM Institutional Services

To be sure, the dollar’s salve would be a pick-up in the economy as Bernanke’s zero interest rate policy forces more risk-taking, more lending, more investment, and more hiring. That theory took a bit of a hit Thursday as first quarter GDP data was released showing a 1.8 percent increase in economic growth, down from a 3.1 percent increase in the fourth quarter.

“If the economy is on a recovery path, as Ben Bernanke suggests, albeit slower than we would like, then we should anticipate that tax receipts and revenues should improve,” said John Person, president of Nationalfutures.com and co-author of the Commodity Trader’s Almanac. “If that happens, then the US Dollar should gain some strength, or at the least cease the rapid descent. Right now it is very hard pressed to find one dollar bull.”

A showdown in Congress is brewing as the U.S. Treasury is poised to hit its debt ceiling in next month. Following a tough battle over the budget this month, traders selling the dollar are bracing for another partisan battle over the debt ceiling vote and possible austerity measures that could be attached to a lifting of this debt limit. Standard & Poor’s changed the outlook on U.S. debt to “negative” last week based on the possibility of a stalemate in enacting any kind of meaningful fiscal policy by this divided government.

“Since S&P downgrade last Monday it has become abundantly clear by policy makers, if it wasn’t already, that the Fed will print whatever it takes to avoid default and debase the buck to a point where it will be very unlikely to remain the world’s reserve currency,” said Dan Nathan, creator of RiskReversal.com.

Follow

Get every new post delivered to your Inbox.

Join 159 other followers