Endgame: When Debt is Fraud, Debt Forgiveness is the Last and Only Remedy
Republished with permission of Charles Hugh Smith | oftwominds
-
We hold this to be self-evident: When Debt is Fraud, Debt Forgiveness is the Last and Only Remedy.
Today I present an important guest essay by long-time contributor Zeus Yiamouyiannis, who suggests that when debt is essentially fraudulent, then debt forgiveness is both the logical and the only remedy. In case you missed his previous analyses on oftwominds.com, I list some of Zeus’s previous essays at the end of the entry.
Endgame: When Debt is Fraud, Debt Forgiveness is the Last and Only Remedy
by Zeus Yiamouyiannis, Ph.D., copyright 2011.
-
Introduction
Finally serious economists are considering a position I have been maintaining and writing about since the 2008 financial meltdown. Whatever its name— erasure, repudiation, abolishment, cancellation, jubilee—debt forgiveness, will have to eventually emerge forefront in global efforts to solve an ongoing systemic financial crisis.
On a grand scale the only way to erase counterfeit money and (counterfeit) assets of hundreds of trillions of dollars is to erase the debts associated with those fake assets. (Let me underscore again, these are not “toxic” assets, they are fake assets.)… Forgiveness in general, and forgiveness of debt in particular, stand as virtues if they free us up to acknowledge, address, and learn from our culpability, start anew, and create forward.” (The Big Squeeze, Part 3: The Quiet Rebellion: Civil Disobedience, Local Markets, and Debt Erasure - January 29, 2011)
Debt forgiveness, therefore, accomplishes two important things. It eliminates the increasing and outsized portion of productive enterprise to pay off unproductive obligations, and it clears the ground for new opportunities, new thinking, invention, and entrepreneurialism. This is why the ability to declare bankruptcy is so essential in the pursuit of both happiness and innovation.
Currently we are mired in a “new normal” and calls for “austerity” which are nothing more than the delusional efforts of a status quo to avoid the consequences of its own error and fraud and to profit evermore. So bedazzled by the false wealth created by debt multiplication and its concomitant fantasy of ever-higher returns, this status quo continues to be stupidly amazed that people are not spending and that the economy is not picking up. But how could it be otherwise?
Productive wealth has been trapped in a web of parasitic theft, counterfeiting, liability evasion, non-regulation, and prosecutorial non-accountability. All the fundamental attributes of a functioning exchange economy have been warped to reward creative criminals. I spoke extensively about this in my posts from 2008. (Imaginary Worth, Empire of Debt: How Modern Finance Created Its Own Downfall - October 15, 2008)
The unsustainable nature of debt
Two observations: 1) Fabricated/parasitic so-called “wealth” destroys value by diluting the value of productive wealth. 2) Debt/credit that cannot be paid back is never an asset and is always a hot-potato liability (needing to be foisted to a greater fool to garner “profit” and transaction fees):
The models [modern debt are] based upon had no contact with reality. They assumed unlimited growth and ability to pay. When matched against the reality of people paying ten times their salary for mortgages that actually added more money owed to their principal (i.e. with negative amortization), required no money down, and set up “balloon payments,” large step-ups in payments after a few years) there is no possible way they could NOT default in a predictable span of time. (Part II: How the Credit Default Swap Scam Works - October 13, 2008)
Systemically, all debt that charges a percentage (“usury”) originates in delusion. Debt grows exponentially indefinitely, growth (income and otherwise) cannot. This leads to a widening condition where the fruits of productive “growth” devoted to interest payments increase until those fruits are entirely consumed. (The Elephant In The Room: Debt Grows Exponentially, While Economies Only Grow In An S-Curve - Washington’s Blog)
Once this happens, stores of wealth (hard assets) begin to be cannibalized to make up for the difference. You see this in Greece with its sale of public assets to private companies, and in middle-class America where people are liquidating retirement accounts to pay for their cost of living.
This problem is compounded by a private Federal Reserve that lends money into circulation at interest, and then allows the multiplication of this consumer debt-money liability through fractional reserve banking. The money in circulation today could pay only a small fraction of the total private and public debt. That fact alone is evidence of a kind of systemic fraud. “If you just work hard enough, save, and make sensible decisions, you can get out of debt” could only physically work for a bare fraction of the population, given the money-to-debt ratio. The rest would have to simply default to clear the boards.
This is why debt forgiveness makes not only moral but rational, mathematical sense. Finances require balancing to be coherent. There must be some way to redress systemic imbalance. One has to be able to “zero the scales” to get an accurate weight of value and to re-establish healthy value creation.
Voices in the debate
Some analysts are beginning to see the forest through the trees in terms of debt forgiveness. Steve Keen, Australian economist and current deflationist, and Michael Hudson, American economic contrarian and prescient essayist, are both using clear-sighted reality-based financial analysis to debunk accounting games that obscure the untenable debt situation and to call for debt forgiveness.
How can selling sovereign assets and imposing austerity on Greek citizens (taking money out of their hands through higher taxes and lower benefits) do anything other than hollow out value and contract the Greek economy in the face of a deep global recession? Michael Hudson: It can’t. Greece’s debt needs to be written off.
It seems unreasonable and unrealistic to expect that large sectors of the New European population can be made subject to salary garnishment throughout their lives, reducing them to a lifetime of debt peonage… (T)he only way to resolve it is to negotiate a debt write-off…” (The Coming European Debt Wars: EU Countries sinking into Depression - Michael Hudson, Global Research, April 9, 2010)
-
([We’ll Have] a Never-Ending Depression Unless We Repudiate the Debt, Which Never Should Have Been Extended In The First Place - Washington’s Blog)
Why isn’t “quantitative easing” and flooding the U.S. economy with debt-money working to prime borrowing and lending? Steve Keen: Because the money is going into deleveraging in a time of overextension:
“Bernanke is throwing (a) trillion dollars into the system. Rather than that leading to ten trillion dollars of additional credit money, creating the inflation people are expecting, that trillion dollars is all that goes in, and people deleveraging actually reduce their level of spending by more than a trillion dollars by trying to pay their debt down, and it cancels out what the government is trying to do… We need a 21st century jubilee.” (On the Edge with . . . Steve Keen (Max Keiser, video)
Other well-known commentators are not seeing the debt forest at all. In their contentious debates over deflation and inflation, neither Rick Ackerman nor Gonzalo Lira seem to be aware of the overwhelmingly fraudulent nature of present global debt- including the 600 to 1,000 trillion dollars of fabricated notional wealth represented by the derivatives markets, fraudclosure, and a host of other sources.
Rick Ackerman: “’Ultimately, every penny of every debt must be paid — if not by the borrower, then by the lender.’ Inflationists and deflationists implicitly agree on this point… and we differ only on the question of who, borrower or lender, will take the hit.” (Let’s Think This Through Together….)
I posted a pithy response in the comment section:
Both Rick and Gonzalo left out the obvious third way-debt forgiveness. No… debt does not have to be paid by someone; it can be absolved, especially debt created upon fraudulent and/or counterfeit-ridden practice… (D)erivatives are not real wealth, and neither was the ostensible climb in the values of housing resting in large part on those phony-wealth derivatives.
The only “real wealth” here revolves around ability to produce real and needed goods (to allow us to survive), and the ability to create something that increases one’s quality of life (to promote our thriving). Precious little of the present global economy involves either one of these. Yeah, if we use FASB standards and Goldman Sachs accounting, we can pretend our worthless junk is all really simply very rare, “unique condition” collectibles worth trillions of dollars.I’ve got a better idea. Take our financial junk out of the global attic in boxes, put them out on the front lawn, and see if anyone wants to pay a few bucks for the various items, give away the leftovers to anyone interested passing on the sidewalk, and recycle, donate, or dispose of the rest. It’s a moving sale, and if our economy is going to get moving, maybe we ought to have one.” (Zeus Yiamouyiannis - April 6, 2011 at 4:11 pm)
How it might play out
This subtle debt extortion creates a system of never-ending debt-slavery for a vast majority of the population. When this “manageable” slavery is aggravated by a desire to use hardship to extort ever greater assets from the overburdened at ever cheaper prices (what Naomi Klein calls “disaster capitalism”), by open and unapologetic widespread fraud, and by the unjust offloading of risk and liability to taxpayers who had nothing to do with poor decisions of private banks, then the systemic abuse is revealed in the daily lives of citizens.
Debt creates scarcity, which stimulates fear, which drives manic competition, which favors opportunism, collusion, and concentrations of power, which translates to abuse, which results in a collapse of legitimacy for the economic system. Overreach causes a breaking point, and we are getting close to it. Will the response be warfare, taxpayer revolt, political upheaval, mass default, debt forgiveness, something other, some combination? I have predicted pockets of violence would be mixed with some softer combination of taxpayer revolt, mass default, political upheaval, and debt forgiveness, along with a return to community exchange to meet basic needs. (The Big Squeeze, Part 3: The Quiet Rebellion: Civil Disobedience, Local Markets, and Debt Erasure - January 29, 2011)
This possibility of epic reprisal may very well compel banks to come to the table around debt forgiveness to avoid violent backlash and criminal prosecution, even over preserving their gravy train companies. The bitter irony of these companies and their galloping greed is that they ended up victimizing each other by selling junk to each other and extracting all the real value in salary and bonuses. Their assets rest on notional values, that when unmasked would drive each into immediate insolvency. They have simply been scam artists, producing little value and extracting mountains of money.
What might this look like? Looking at present trends and using the very useful framework of Kubler-Ross’s stages of grief, it might go something like this…
Average debtor:
- Denial: Liquidate savings to pay for over-priced house and cost of living.
- Anger and fear: Exhaust resources, experience want, compounded by austerity measures.
- Bargaining: Attempt to negotiate with bank through HAMP and other mechanisms to lower payments. Banks don ‘t bite and even have incentives to foreclose.
- Depression: Lose/default on the house and move in with family or cheap rental.
- Find out life is better without being a debt slave and spend more time with community and the ones you love.
Bankers:
- Denial: Collect 144 billion in bonuses after financial collapse and laugh as not a single trading day loss arises for zombie TBTF banks completely subsidized by governments.
- Anger: Express false righteousness, indignation, and hubris over even modest/toothless demands/regulations attempted to be placed on them by governments. Exhibit sadistic zeal at being able to simply claim you own and liquidate properties they have no clear title to.
- Bargaining: Experience dawning awareness that may have just cooked your own gooses as strategic defaults skyrocket, populist demands to prosecute fraudclosure gain traction, and quantitative easing ad infinitum dwindles and fails to keep stock prices artificially aloft. Improvise panicked attempts to “be reasonable” and actually negotiate, once the asset and money flow well runs dry.
- Depression: Contemplate and realize possible bankruptcy by big banks. Retreat to the Hamptons to hire criminal defense lawyers, contemplate empty life, and shoulder the abuse of media and contempt of a global citizenry.
- Acceptance: Trying to regain “good guy” status and avoid criminal prosecution by agreeing to be part of debt forgiveness.
Once defaults happen in increasing numbers and certain asset prices plunge (i.e. real estate), what will initially look like a bonanza for capitalist parasites could easily get out of hand, with people either unable or unwilling to buy inventory even at greatly reduced prices. Profits would tank at banks, liabilities would skyrocket even with most of it transferred to government guarantee. Because no one plays the game anymore, banks could go under as well, as people rise to vote out bank-friendly politicians and simply refuse to pay. This unraveling could easily force exposure of the notional value of derivatives in banks as worthless, meaning they are as bankrupt as the people they exploited. At this point, there will be a common desire and need to simply “forgive” the debts and try to find some way to distribute these empty homes.
Conclusion
Debt forgiveness simply calls out either the inherent systemic inability to make good on debts or the recognition that debt was produced through fraudulent means. In the present situation, both conditions obtain. There has likely been no point in world history where debt forgiveness has been so comprehensively merited. The only speculation from my point (barring world-wide global feudalism and eternal debt slavery) is whether we will initiate such forgiveness or be forced into it.
-
Thank you, Zeus, for this prescient and insightful analysis of debt and debt renunciation. The Kondratieff Cycle can only turn to Spring after debt renunciation completes the Winter cycle. Let’s stop pretending we’re still in Summer, and that the Fed’s puny “quantitative easing” and monetary cargo-cult machinations can reverse the seasons.
(all essays by Zeus Yiamouyiannis, Ph.D.)
Part I: A 70 Trillion Dollar Counterfeiting Ring
(September 23, 2008)
According to several sources the market for so-called “credit default swaps” last year alone was nearly equal to the total global GDP, around 70 trillion dollars by some estimates. Yet these derivatives have no discernible “origin” or value.
Part II: How the Credit Default Swap Scam Works
(October 13, 2008)
Instead of asking the obvious, complex, and obscuring question, “What value DO they have?”, one should ask the elegant and simple question, “What value COULD they have?” Even a cursory examination would seem to indicate that the answer is either zero or less-than-zero.
Part III: Credit Default Swaps Create Less-Than-Zero Value
(October 13, 2008)
Now, how can a supposed “asset” like credit default swaps have a “less-than-zero” (negative) value. First, credit default swaps were insuring debt. Debt is not an asset as I explained in previous essays, but a liability. Mistake number one was to confuse asset and liability.
Part IV: There Is Ultimately No Gaming the System: When the Micro Crash Reflects the Macro Crash
(September 29, 2008)
The proposed 700 billion dollar bailout cannot really “work” from a system level. I know it’s real intention is to cover the butts of Wall Street investors, but you have the same problem in macro that homeowners have in micro. Nobody knows what homes are worth right now, so buyers are sitting it out. It isn’t about restricted credit (even though that is a factor). It isn’t about being too cash strapped to make a down payment (though that too is a factor). It’s about not wanting to be suckered into buying something that may still be overpriced.


 Just around the time silver suffered a waterfall decline, one little known “asset class” experienced an explosive gain of around 800% in a matter of weeks. It’s not gold, certainly not silver.


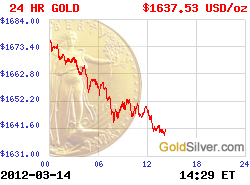
 More Charts: 1-Month, 1-Year, 5-Year, 10-Year
 More Charts: 1-Month, 1-Year, 5-Year, 10-Year
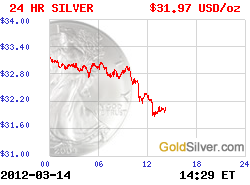

Recent Comments