PAGE is Dead. New Allocated Silver Exchange in the Making.

Pan Asia Gold Exchange (PAGE) building in Kunming City, Yunnan, China
-
The much awaited China-based Pan Asia Gold Exchange (PAGE) was scheduled to start trading this June after a ‘soft’ launch at the end of 2011. This exchange that could potentially bring down the Ponzi bullion banking system has been killed before it could see the light of day, according to recent disclosures by Ned Naylor-Leyland and London whistleblower Andrew Maguire.
So “dangerous” was this exchange to the status quo that it faced interference from “a New York based entity with very strong Chinese relationships” soon after the much publicized soft launch. Another factor that helped derail PAGE was the People’s Bank of China’s (PBoC) announcement about control over domestic Gold trading outside of Shanghai.
Before we go into the details of this news, let’s revisit why PAGE managed to send chills down the spine of the powers that be. Consider the following:-
- Currently the prices of gold & silver bullion you pay at your favorite bullion dealers are pegged to or based on the prices of gold & silver contracts transacted at the COMEX in NY and the LBMA in London.
- These contracts are merely paper or electronic representations of gold & silver with little or no physical metals actually changing hands. They are highly leveraged, with approximately 100 oz of paper gold contracts backed by 1 oz of physical gold. For silver, the ratio is about 350:1
- A very very small number of bullion banks (2 to 4) control up to 95% of these paper contracts, and hence are able to influence the price of physical bullion. As ridiculous as it sounds, this is the current price discovery mechanism - virtual paper metals setting the price for physical metals or the classic “tail wagging the dog” mechanism.
- These contracts are denominated in USD.
- PAGE was designed to trade in 100% allocated gold & silver contracts with metals backing paper contracts on a 1:1 ratio.
- The contracts would be denominated in RMB
What could have happened had PAGE gone “live”
- Investors would switch from COMEX/LBMA to PAGE because of the 1:1 ratio. When they enter into a long (buy) contract, they can be sure there’s physical metals available when they want to take delivery. This is especially so after the MF Global failure. That’s loss of business from the former to the later.
- The price discovery mechanism will no longer be a monopoly. Your bullion dealers would most likely peg their prices closer to the 1:1 contract price than the 350:1 contract price. After all, they are dealing with the real stuff - physical bullion. Without a monopoly in price discovery, the bullion banks will be less effective in their interventions of the gold & silver markets. The decades long price suppression of these political metals may finally come to an end.
- Investors need to sell USD to buy RMB when entering into these RMB denominated contracts. Another “commodity” bites the dust as far as dependence on the USD is concerned (after Japan, China, Russia, India and Iran joins the Asian Dollar Exclusion Zone to trade using their national currencies).
- Physical gold & silver would be moving from west to east at an even more rapid rate, speeding up the transfer of economic, financial and political power in that direction. Whichever way you look at it, gold and silver are political metals. Recall what Nixon did after physical gold started flowing out of the US following Charles de Gaulle’s demand to exchange dollar for gold.
When such a potential game changer was being conceived, something had to be done, and sure they did. In his recently published research notes “P.A.G.E. Squashed: And now for something completely different…“, Ned Naylor-Leyland of Cheviot Asset Management explains how PAGE was killed.
Just after the publicized ‘soft launch’ (with Central government mandarins in attendance) and the noise made on the internet about its implications, the one shareholder in PAGE that had a foreign listing (in the US) suddenly and stealthily increased its share-holding from 10% to 25%, acquiring additional board directors along the way. The rationale for this sudden change in the weighting of shareholders is shrouded in mystery, however what we do know is that this entity then insisted that they be allowed to build the trading platforms for PAGE from the ground up, rather than buying a working platform off the shelf to get PAGE operational in a timely manner.
This blocking tactic at board level effectively stopped the progress of the fully-allocated spot contract in its tracks, and it was immediately clear to the international-facing people that something fundamental had changed internally. Interestingly, the key Independent Director of this small listed entity that blocked the timely roll-out of PAGE is a well-known Western banker within China, whose CV includes work for the Federal Trade Commission, the Sloan Foundation (related to MIT) and his wife is a member of the Council on Foreign Relations.
-
London whistleblower Andrew Maguire told King World News:
I’d like to briefly remind King World News listeners just what PAGE (the Pan Asian Gold Exchange) was going to be. This was going to be a Chinese Exchange that was to completely change the way gold and silver trade globally.
If you recall from our previous interview, it posed an immediate threat to the current fractional reserve bullion banking system. It was the competition of a brand new fully allocated gold and silver contract being pitched up against unbacked paper contracts. It’s not a stretch to imagine what a threat these contracts posed to the bullion banks.
The whole thing was killed and we recently found out how PAGE was interfered with. Within hours of our King World News interview last July, I mean you sure get some hits on your show, Eric, the interference stemmed out of a New York based entity with very strong Chinese relationships. It delayed it enough to kill it and it was killed.
Silver Lining
All is not lost. The people originally behind PAGE have begun work on developing another independent exchange which is more streamlined and better funded, focusing on 1:1 silver contracts to bypass the new PBoC ruling on gold. According to Ned, it is expected to go ‘live’ this summer (northern). Let’s give the bullion banks a few more months!
The aforementioned change in domestic Chinese rules mean that along with every other regional Precious Metals exchange, the new unnamed 1:1 allocated exchange is launching with Silver initially, which of course is the Achilles Heel of the Bullion banking system. This in my opinion is far more bullish and exciting short and medium-term than the Gold contract would have been, as the physical Silver market is so tight.
Furthermore, all the regional exchanges mothballed by the PBoC rule change can switch, and are switching to Silver trading which is not covered by the change in rules. The contract itself will be, as before, an international rolling 90 day spot one, denominated in RMB, and the new entity is supported by the same serious players within the Chinese political and military establishment as before. The physical will be acquired ahead of closing each monthly tranche and will be vaulted entirely outside of the Bullion Banks (i.e. private vaulting facilities). From there the allocated receipts will be recorded on an electronic register and the issue will be tradeable in the secondary market with the register adjusted real-time.
This is extremely good news for holders of real Silver and extremely bad news for holders of fake paper Silver who rely on the 350:1 leverage being maintained as the world’s sole price discovery mechanism for large purchases of the white metal. This effectively will be like dealing in an RMB-denominated and fully allocated version of some of the popular Silver Bullion Trusts, but rather than trading at a premium, the premium will price the issue ahead of purchase, affecting global price discovery, as previously mooted.
-
Read the rest of Ned’s report at TFMetalsReport.com. There also an podcast of Ned’s interview with Turd Ferguson on the same page. Listen to Andrew Maguire’s interview with Eric of KingWorldNews here.
-
Related Articles:
-


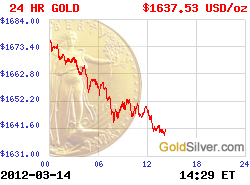
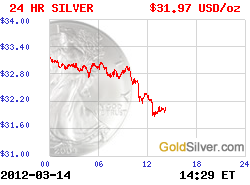
 More Charts: 1-Month, 1-Year, 5-Year, 10-Year
 More Charts: 1-Month, 1-Year, 5-Year, 10-Year
