by Jonathan Kosares | USAGold
-
Caveat Lector
“Let the Reader Beware”
Members of Wells Fargo’s wealth management team released an article recently entitled, “The Gold Bubble,” where it is claimed, in no uncertain terms, that gold is in a bubble. While I would not normally spend time rebutting an entity that would shock me far more if they actually put out a recommendation to buy gold, the subsequent readership this article has received (it was referenced in the business section of the Denver Post, for example) suggests it might be an entertaining, and perhaps useful exercise, to dissect their claims point by point to see what, if any, validity they carry. I also am of the impression that, as coverage on gold becomes increasingly mainstream, gold owners will also be faced with an increasing sum of articles of this type that seek to challenge their resolve. My hope is that this analysis will provide something of template of skepticism, that not everything you read, no matter how credible the source, is necessarily giving you the complete picture.
In their introduction, Wells Fargo Wealth Management (WFWM) writes,
“As with all bubbles, we know that we run the risk that our view may turn out to be wrong (“early” would be our preferred euphemism) in the short run; however, we believe that we will be proven right in the long run. Some will vehemently call us “crazy” and “naïve” for being unenlightened to gold’s zero gravity investment properties, but that will only help to steel our convictions (we similarly took our licks from critics in the past when we expressed concerns about speculative bubbles in technology stocks and housing).”
I’m immediately suspicious of an argument that seeks to so craftily rebuff and undermine any response before it is even presented. Yet, I find myself willing to risk ridicule, to ‘steel the conviction’ of Wells Fargo, to show that while even the craziest prediction can be proven right given enough time, in this case Wells Fargo isn’t just ‘early’, they’re way too early, and they aren’t ‘crazy’ or ‘naïve’, they’re just plain wrong. In defense of their conclusion, WFWM presents seven arguments. They are as follows:
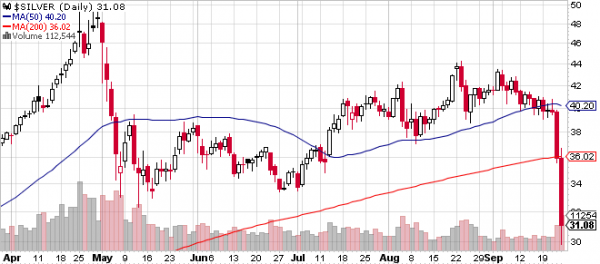
WFWM - Volatile Price Movements: With very little warning, the bottom can drop out on gold prices very quickly. For example, during six short months in 2008, gold lost more than 30 percent of its value. In the 1980s, in a little more than two years, the price of gold dropped approximately 65 percent. When fear subsides, inflation doesn’t sky-rocket, and everything begins to return to “normal,” demand for gold can fade away quickly. Last week in response to rising volatility in gold prices the Chicago Mercantile Exchange (CME), the world’s largest futures market, raised the margin requirements for trading gold futures contracts by 22 percent. The CME has a history of raising margin requirements on futures contracts when price volatility increases as a way of further protecting investors’ interests.
JK - Gold did lose 30% of its value in six months during the last half of 2008. However, over the exact same six months referred, the DOW lost 47% of its value. Moreover, it only took gold a little over three moths to recover its losses and ultimately surpass its value before the drop. Three years later the Dow has yet to recover its pre-drop levels. The second statement is also true, however it needs to also be noted that gold doubled twice in the year preceding the referenced drop, going from just over $226/oz to $875 at its peak (that’s a 387% increase in one year!). At the writing of this article, even granting this advisory the very top in gold at $1919, gold has increased a manageable 47% in the last year, a mere fraction of what it did in a year’s time in 1980. Put another way, the pace of gold’s performance this August (a 22% gain) would have to increase to 30% monthly, and continue for an entire year to accomplish the same percentage gains seen in 1979. The next claim that gold will fall ‘when fear subsides…’ is nebulous, at best. At a minimum, this supposition should be led with an “if”. Much is assumed by the word “when”. When is “when”? Next year? Five years from now? To say a lot can happen between now and when ‘when’ is a reality would be an understatement.
In continuing, the authors of this article are doing a serious disservice to their readers by suggesting the practice of raising margin requirements carries some ‘profound significance’ to a market, specifically the gold market. Futures are priced in terms of fixed dollar figures, not percentages. So as the price of an asset increases, the margin, or the amount of money it takes to control a futures contract, while remaining constant in dollar terms, is gradually reduced percentage-wise. In essence, by not raising margin requirements as the underlying asset appreciates, the CME indirectly adds leverage to the market (it takes the same amount of money to control increasingly valuable contracts). By raising margins, the CME simply recalibrates the nominal, or dollar, amount required to control a contract to be more appropriately balanced against the value of the contract, thereby removing this added leverage. This process most frequently and logically occurs when a market makes a sharp, one-directional move. Not because of a general environment of ‘increased volatility’ as is suggested here. For some added context, it had been about a year since CME had hiked rates for gold futures at the time of this notice by WFWM. In that time, the price of gold appreciated 47%, so the referenced hike of 22%, and subsequent 27% hike on August 24th, are exactly equivalent to the underlying rise in the gold price, plus a small cushion.
WFWM - No Income: Most investments have some sort of cash flow potential: stocks have dividends, bonds have coupons, and real estate has rent. This flow creates intrinsic value. However, gold, like many other commodities, does not have any simple, inherent cash flow. In fact, when one factors the incumbent costs of ownership (transportation, storage, insurance, protection, assay fees, etc.), gold, in its physical or derivative form, can actually be considered to have a negative yield.
JK - This has long been the argument against gold ownership by the financial community in favor of alternative asset classes. But to be fair, gold ownership shouldn’t be in competition with the asset classes listed here. What gold ought to compete with in an individual’s portfolio are money market accounts, savings accounts, CD’s and other cash instruments. Most of the analysts calling gold a bubble are missing the key role gold serves, which is as an international currency, and savings vehicle, separate from the eroding effect of government policy. Those who understand the true value of gold ownership know ‘income’ isn’t the true goal.
WFWM - Greater Fool Dependence: Because it has no inherent earnings power and little intrinsic value, investors in gold are hoping that other investors will come along to bid up their holdings in the future. While a common tactic of speculators, the “greater fool” approach is rarely a good long-term investment strategy. In fact, it was this strategy that led us to the recent housing market crisis. During that period, lenders, homeowners and real estate investors assumed that home prices would continue to climb into perpetuity.
JK – If this is an attempt to refute supply/demand economics, it takes more than three sentences. Moreover, by this broadly stated and poorly supported metric, nearly every freely traded investment vehicle on the planet is governed by the same dependence on the “greater fool”. Stocks are certainly no different. In fact, it is the premise of one person believing something is worth more or less than another that ultimately makes a ‘free’ market. The only market that would not have the presence of a ‘greater fool’ would be the one that never came down, or traded at a constant value, which in truth, is no market at all. Where this argument is truly flawed however is by failing to acknowledge again the evolving role of gold as a currency within the international monetary system. It is the only currency that cannot be printed and debased, and whose value is not subject to the stability (or instability) of a local government. Though gold is indeed of ‘little intrinsic value’ when viewed solely for its uses as a pure commodity, its bull run has nothing to do with the metrics that drive the value of pure commodities like food, grain and energy. As Alan Greenspan stated recently, “Gold, unlike all other commodities, is a currency. And the major thrust in the demand for gold is not for jewelry. It’s not for anything other than an escape from what is perceived to be a fiat money system, paper money, that seems to be deteriorating.” To put it another way, gold ownership is an expression of a belief that those who blindly retain currency in this environment are perhaps the ‘greatest fools’ of all.
WFWM - Central Bank Activity: Lately, there has been a great deal of attention in the news about central bank purchases of gold. However, it is important to note that, in aggregate, the central banks of developed countries have been net sellers of gold in recent years. That trend may change since the political back-drop of future supply and demand dynamics of central banks is quite difficult to predict.
JK – Wait a second…this is a bearish argument for gold? So central banks for the first time in a decade are net buyers of gold, suggesting a broad-based shift in sentiment, and that’s a bearish indicator? And the trend may change because it is difficult to predict the political back-drop of future supply and demand dynamics? Not to be cynical, but would it not be equally difficult to predict the political backdrop of future bail-outs should banks find themselves undercapitalized in the future? That aside, central bank activity is not extraordinarily complex, as this would insinuate. Central banks are responding to the current environment in the same way as individual investors. As a general practice, central banks hold a basket of currencies, so they are buying gold, not necessarily to make a return, but to hedge the inherent risk within their reserves. As long as nation states as a group pursue policies meant to debase their currencies, central banks, and in many cases those same central banks, will continue to be buyers of gold for the same reasons most private investors own it.
WF - Inflation Fighting Properties are Overstated: The chart below challenges the idea that gold is an effective hedge against inflation, as it shows that stocks have experienced a far superior after-inflation-adjusted return over the past 25 years. This longer time-frame view of gold puts into perspective a more realistic time horizon for many investors.
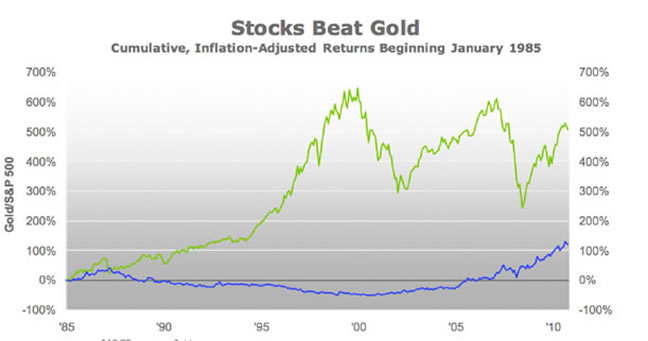
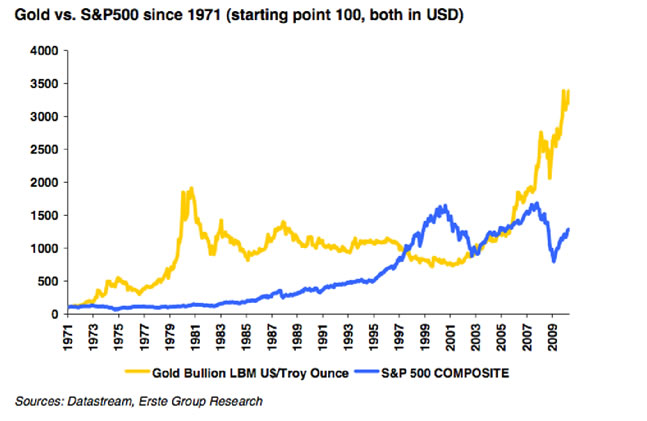
JK – I have a chart too, courtesy of Ronald Stoferle and the Erste Group. And mine goes back farther, with a longer time-frame view, 1971 to be exact, and there isn’t even a worthwhile comparison. The problem with the graph above is that it comprises the greatest 20-year bull market in stock history, while also including the most disheartening 20-year bear market in gold. Wells Fargo has chosen an awfully convenient date range to make their argument.
Warren Buffet’s View on Gold Values: In a recent interview on CNBC, the renowned investor Warren Buffett crystallized the concerns that prudent investors have with gold at current price levels:
 “. . .if you took all of the gold in the world it would roughly make a cube 67 feet on a side and that would be the whole thing. Now for that same cube of gold it would be worth at today’s market prices about $7 trillion. That’s probably about a third of the value of all the stocks in the United States. So you could have a choice of owning a third of all the stocks in the United States or you could have a choice of owning that little block of gold, which can’t do anything but kind of shine there and make you feel like Midas or Croesus or something of the sort.
Now, for $7 trillion, there are roughly a billion of farm-acres of farmland in the United States. They’re valued at about $2 1/2 trillion. It’s about half the continental United States, this farmland. You could have all the farmland in the United States, you could have about seven ExxonMobils, and you could have $1 trillion of walking around money. And if you offered me the choice of looking at some 67-foot cube of gold and looking at it all day, you know, I mean touching it and fondling it occasionally, you know, and then saying, you know, `Do something for me,’ and it says, `I don’t do anything. I just stand here and look pretty.’ And the alternative to that was to have all the farmland of the country, everything, cotton, corn, soybeans, seven ExxonMobils. Just think of that. Add $1 trillion of walking around money. I, you know, maybe call me crazy but I’ll take the farmland and the ExxonMobils.”
JK – This isn’t the first time these comments by Warren Buffett have been utilized in an argument against gold ownership. I think its use in this case is due some context, however. First, this interview wasn’t all that ‘recent’. In fact, it was conducted with Ben Stein on October 19, 2010, when the gold price was $1335.00… not during the very recent run up in the gold prices, as this article suggests. Second, Buffet’s recommendation in lieu of gold?… buy the VTI, or Vanguard total market index ETF. At the time of the above interview, VTI was trading at $62 and change, which is exactly the same price it is trading for today, versus a 35%+ increase the gold price. Last, and most importantly, this is an unrealistic comparison for the everyday investor. Buffett speaks of owning all of the gold in the world, versus what all of that gold could buy. In the vacuum of extremes, perhaps Buffett’s thoughts aren’t incorrect. They make a sort of sense to me. But the reality is that no one could buy all of the farmland in the United States. Nor could one individual own all of the gold. It isn’t a practical comparison. Cases for or against owning an asset need to be made in reality, and the reality is that gold ownership is spread across millions of owners, who all believe it has a value beyond ‘looking pretty’. Because of this universal belief, gold commands a relevance that should not be so cynically dismissed.
You Can’t Eat Gold: For all the talk of gold’s antidotal properties vis-à-vis fiat currencies, beyond its few industrial and jewelry uses, it is hard to see that gold has much intrinsic value. Gold doesn’t readily produce cash flow, doesn’t provide shelter, can’t be eaten, nor does it provide efficient clothing. There is certainly some intrinsic value, but, in our view, not $1,800 per ounce worth of intrinsic value. Further, all sound investments provide some element of societal benefit. However, digging gold up out of the ground, refining it, forming it into bars, and then burying it back in the ground again—specifically in elaborate, highly-protected underground vaults—doesn’t seem to provide substantive economic value to society, other than being a short-term speculative store of value.
JK - I think I’ll reflect on the thought above while snacking on a salad of $100 bills beneath the shade of my stock certificates. Mmmmm, so satisfying. Yes, this argument is that silly. And to the thought of providing an economic benefit to society, I’d say simply this: Nothing is of greater economic detriment to society than government policy that uses debt, currency debasement, and leverage to produce the illusion of perpetual economic growth. So if gold, since it is uniquely detached from the eroding effect of these government policies, protects its owners against their repercussions, it is certainly of substantive economic benefit to the individual. For nothing else so efficiently provides the protection and peace of mind otherwise absent in the majority of today’s investment options.
-


 More Charts: 1-Month, 1-Year, 5-Year, 10-Year
 More Charts: 1-Month, 1-Year, 5-Year, 10-Year

Recent Comments