Silver Eagles Soar
Submitted by: Richard (Rick) Mills | Ahead of the Herd
-
As a general rule, the most successful man in life is the man who has the best information
In World War I severe material shortages played havoc with production schedules and caused lengthy delays in implementing programs. This led to development of the Harbord List – a list of 42 materials deemed critical to the military.
After World War II the United States created the National Defense Stockpile (NDS) to acquire and store critical strategic materials for national defense purposes. The Defense Logistics Agency Strategic Materials (DLA Strategic Materials) oversees operations of the NDS and their primary mission is to “protect the nation against a dangerous and costly dependence upon foreign sources of supply for critical materials in times of national emergency.”
The NDS was intended for all essential civilian and military uses in times of emergencies. In 1992, Congress directed that the bulk of these stored commodities be sold. Revenues from the sales went to the Treasury General Fund and a variety of defense programs - the Foreign Military Sales program, military personnel benefits, and the buyback of broadband frequencies for military use.
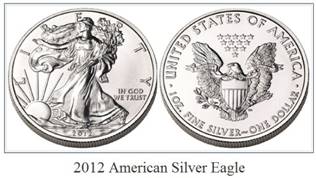
American Silver Eagle
The American Silver Eagle is the official silver bullion coin of the United States. It was first released by the United States Mint on November 24, 1986 and is struck only in the one troy ounce size.
 The Bullion American Silver Eagle sales program ultimately came about because the US government wanted, during the 1970s and early 1980s, to sell off what it considered excess silver from the Defense National Stockpile.
“Several administrations had sought unsuccessfully to sell silver from the stockpile, arguing that domestic production of silver far exceeds strategic needs. But mining-state interests had opposed any sale, as had pro-military legislators who wanted assurances that the proceeds would be used to buy materials more urgently needed for the stockpile rather than merely to reduce the federal deficit.” Wall Street Journal
The authorizing legislation for the American Silver Eagle bullion sales program required that the silver used for the coins had to be from the Defense National Stockpile. By 2002 the DNS stockpile was so depleted of silver that if the American Silver Eagle bullion sales program was to continue further legislation was required.
On June 6, 2002, Senator Harry Reid (D-Nevada) introduced the Support of American Eagle Silver Bullion Program Act to “authorize the Secretary of the Treasury to purchase silver on the open market when the silver stockpile is depleted.”
2002 - 10,539,026 Bullion American Silver Eagles were sold.
2003 - 8,495,008 Bullion American Silver Eagles were sold, silver averaged $4.88 an ounce for the year.
2004 - 8,882,754 Bullion American Silver Eagles were sold. For 2004 the average cost of an ounce of silver was $6.67.
2005 - 8,891,025 Bullion American Silver Eagles were sold. Silver averaged $7.32 an ounce.
2006 - 10,676,522 Bullion American Silver Eagles were sold. Silver averaged $11.55 an ounce
2007 - 9,028,036 Bullion American Silver Eagles were sold.
2008 - 20,583,000 Bullion American Silver Eagles were sold. Silver averaged $14.99 an ounce and almost 80% more Bullion American Silver Eagles were sold then in any previous year.
The US Mint suspended sales of the silver bullion coins to its network of authorized purchasers twice during the year.
In March 2008, sales increased nine times over the month before - 200,000 to 1,855,000.
In April 2008, the United States Mint had to start an allocation program, effectively rationing Silver Eagle bullion coins to authorized dealers on a weekly basis due to “unprecedented demand.”
On June 6, 2008, the Mint announced that all incoming silver planchets were being used to produce only bullion issues of the Silver Eagle and not proof or uncirculated collectible issues.
The 2008 Proof Silver Eagle became unavailable for purchase from the United States Mint in August 2008.
2009 - 30,459,000 Bullion American Silver Eagles were sold
On March 5, 2009, the United States Mint announced that the proof and uncirculated versions of the Silver Eagle coin for that year were temporarily suspended due to continuing high demand for the bullion version.
On October 6, 2009, the Mint announced that the collectible versions of the Silver Eagle coin would not be produced for 2009.
The sale of 2009 Silver Eagle bullion coins was suspended from November 24 to December 6 and the allocation program was re-instituted on December 7.
Silver Eagle bullion coins sold out on January 12, 2010.
The average cost of an ounce of silver in 2009 was $14.67
2010
No proof Silver Eagles were released through the first ten months of the year, and there was a complete cancellation of the uncirculated Silver Eagles.
Production of the 2010 Silver Eagle bullion coins began in January instead of December as usual. The coins were distributed to authorized dealers under an allocation program until September 3.
In 2010 the US Mint sold 34,700,000 Bullion American Silver Eagle Coins.
2011
According to the USGS’s most recent Silver Mineral Industry Survey, silver production fell to 37 tonnes in October - compared to 53 tonnes year over year (yoy).
In 2011, the United States produced approximately 1,054 tonnes of silver – down from 2010’s production of 1,154 tonnes and down from 2007’s production of 1,163 tonnes.
 The US imported 6,600,000 oz of silver for consumption in 2011 – up from 2007’s imports of 4,830,000 oz.
In 2011 the US Mint sold 39,868,500 Bullion American Silver Eagle Coins.
2011 was the first year in which official coin sales will surpass domestic silver production.
Jeff Clark of Casey Research writes“For the first time in history, sales of silver Eagle and Maple Leaf coins surpassed domestic production in both the US and Canada. Throw in the fact that by most estimates less than 5% of the US population owns any gold or silver and you can see how precarious the situation is. A supply squeeze is not out of the question – rather it is coming to look more and more likely with each passing month.”
The US Mint is required by law to mint the bullion Silver Eagles to meet public demand for precious metal coins as an investment option. The numismatic versions of the coin (proof and uncirculated) were added by the Mint solely for collectors.
2012
United States Mint Authorized Purchasers (AP’s) ordered 3,197,000 Bullion American Silver Eagle Coins on January 3rd, the first day they went on sale. That opening day total catapulted January Bullion Eagle sales higher than half of the monthly totals in 2011.
As of January 25th 2012, 5,547,000 Bullion American Silver Eagle Coins had been sold.
Bullion Silver Eagles are guaranteed for weight and purity by the government of the United States and because of this the US government allows bullion Silver Eagles to be added to Individual Retirement Accounts (IRAs).
Conclusion
The twin policies of zero interest rates and the continual creation of money and credit being enacted today, by all governments and central banks, means that the purchase of precious metals is the only way to protect the value of your assets.
“Mark my words, if the interest rates on U.S. government debt truly reflected both the real level of inflation in this country and the rising risk of some form of default, rates would already by sky-high and the U.S. would resemble a massive Greece.” John Embry, Chief Investment Strategist, Sprott Asset Management
Investors are currently risk adverse and mining stocks are not well understood by the general investing public, but at least one thing is going to become very apparent to most - the best way to hedge yourself against inflation could be owning silver.
Junior resource companies offer the greatest leverage to increasing demand and rising prices for silver. Junior resource companies are soon going to have their turn under the investment spotlight and should be on every investors radar screen. Are they on yours?
If not, maybe they should be.
Richard (Rick) Mills
[email protected]
www.aheadoftheherd.com


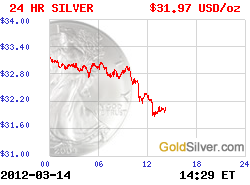
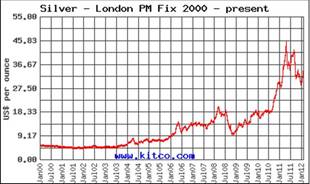
 More Charts: 1-Month, 1-Year, 5-Year, 10-Year
 More Charts: 1-Month, 1-Year, 5-Year, 10-Year
