The latest on Silver Market Manipulation
-
More than 3 years into an investigation over alleged manipulation in the silver market, the CFTC released the following statement yesterday.
CFTC Statement Regarding Enforcement Investigation of the Silver Markets
Washington, DC – The Commodity Futures Trading Commission today issued the following statement:
“In September of 2008, the Commission announced the existence of an enforcement investigation into the possibility of unlawful acts in silver markets. Since that time, the staff has analyzed over 100,000 documents and interviewed dozens of witnesses and obtained expert advice. It has been a long, detailed, and thorough investigation, and it continues in an appropriate and considered manner.”
Bart Chilton, one of the commissioners of CFTC was interviewed, I believe for the first time by Eric King of KWN yesterday:
I can tell you based on what I have been told by members of the public and reviewed in publicly available documents, I believe that there’s been violations of the law, The Commodity Exchange Act.
What was he told by members of the public that convinced him to believe that the silver market has been illegally manipulated? Probably referring to whistle blower Andrew Maguire’s emails to CFTC in February 2010, Chilton had this to say:
But when people email me and say, ‘You watch the market (silver) between 9:15 and 9:45 tomorrow and it’s going to tank or it’s going to do this or it’s going to do that.’ I hold on to it and I watch the market and what they say happens, and I’m not saying this always happens, but it happens even 50% of the time, 60% of the time, there’s no way that doesn’t raise my antenna, like major, electric antenna goes up.
With the derivatives market on the verge of implosion in the wake of the Eurozone crisis, any further announcement implying JP Morgan et al may well be what’s required to nudge us over the tipping point. The next few weeks/months could turn out to be very interesting times. However, updates will be few and far in between while I’m taking a break in the Andeas until Feb 2011.
Stay prepared.
Update:
ZeroHedge just reported a very significant event that may affect global markets next week:
… the CME just made the maintenance margin, traditionally about 26% lower than the initial margin for specs, equal. For everything. Which means that by close of business Monday, millions of options and futures holders will be forced to deposit billions in additional capital to the CME just so they are not found to be margin deficient, and thus receive a margin call. Naturally, since it is very unlikely that this incremental amount of liquidity can be easily procured in one business day, we anticipate the issuance of hundreds of thousands of margin calls Monday, followed by forced liquidations of margin accounts across America… and the world. Just like when Lehman blew up, it took 5 days for Money Markets to break. Is this unprecedented elimination in the distinction between initial and maintenance margin the post-MF equivalent of the first domino to fall this time around?
Update:
There’s another update from ZeroHedge based on a clarification from CME following yesterday’s release.
Yesterday, in what is the worst-phrased and most misleading press release to ever come out of the CME, the exchange issued a notice that going forward all Initial margin would be equal to Maintenance margin. Our gut interpretation was that “Unless we are completely reading it incorrectly, it is nothing short of a margin call for tens if not hundreds of billions worth of product.” Judging by the broad response, our initial reaction is what a prudent, logical human being would assume: after all, it is precisely the undercollateralization of customer accounts, and general underfunding at MF Global that is what brought that particular company down. Well, we wrong wrong. The CME, it appears has taken a page right out of the European playbook, and less than a week after an exchange-cum-Primary Dealer collapsed due to excessive risk taking, the CME has followed up its vague press release from yesterday by inviting even more risk in lowering the initial margin. Why is this a cause for even greater concern? As the CME itself says, “Initial margins are set to provide an additional buffer against future losses in the account” - so going forward that buffer has been reduced by about 30%. But what is the reasoning provided by CME: “The intent and effect of these changes is to decrease the size of any margin calls resulting from the bulk transfer of MF Global customers to new clearing members, not to increase them.” So basically the CME is implicitly putting all of its existing and current clients and customers at further risk by onboarding the accounts of those clients who, like lemmings, held on to their MF Global accounts until after it was too late. Because while the lower Initial margin may apply to MF accounts, it will also apply to any Tom, Dick and Harry beginning Monday, who will suddenly see a 30% reduced gating threshold to put on a position. Any position, no matter how risky. Read full report here.
-
Related Articles:
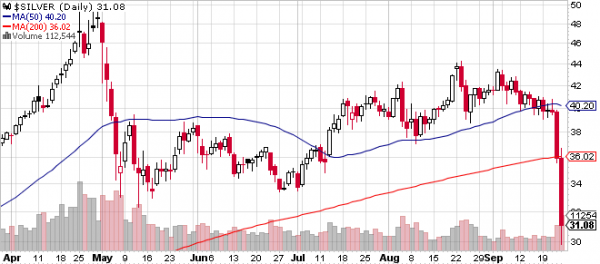


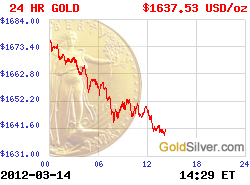
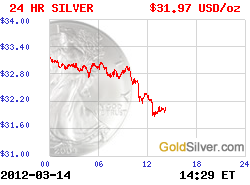
 More Charts: 1-Month, 1-Year, 5-Year, 10-Year
 More Charts: 1-Month, 1-Year, 5-Year, 10-Year

Recent Comments