Why $20,000 Gold doesn’t excite me
-
It scares me!
Gold punched through $1,900 today. If the current financial system can withstand the stress and remained intact till the day gold trades at $20,000 an ounce, what will life be like then?
If we’re holding gold at that time, we may be doing fine but we are not likely to be 10 times richer. That’s because nothing much has happened to our gold. Rather, paper currencies would have lost so much purchasing power that it would take 10 times more of the same to buy what we could buy today. A Big Mac will most likely cost around $43 in the US. In Malaysia, NZ and Britain, it’ll like be around RM76, NZ$54 and £25 respectively (estimates based on Big Mac Index). When a basic meal costs that much, life can be very tough for savers who continued holding on to their paper currencies or other paper assets.
Many of my friends and relatives, from retired professionals to missionaries have been ill advised to rely on supposedly safe or high yielding investments like mutual funds, government managed pension schemes, term deposits or hot stocks to generate passive income or preserve the value of their retirement funds. Despite being presented with information from this website and elsewhere, there’s little affinity shown towards gold or silver. This scares me and for their sake, I hope gold does not get anywhere close to $20,000 before they get on board.
What’s even scarier is the fact that an enormously huge segment of society do not have the means to get on board, even if they wanted to. We’re looking at the 1.4 billion people living on less than NZ$2.25 a day. That’s less than 0.05 ounces of silver! They worry not about the Fed nor the Cartel but about how to provide food, clothing, housing and healthcare with that amount each day. It’s about survival, not savings. Pause for a moment to imagine their plight when gold hits $20,000. Spare them a thought today, and check out their appeal for assistance.
Why $20,000 gold?
In this recently released documentary, Mike Maloney presents the case for $20,000 gold by stepping back and looking at the big picture. He takes us back, very far back, and paints us a very big picture. This excellent educational video is a must watch, especially if you’re new to the Political Metals space. It’ll be your 90 minutes well spent.
But if you can’t spare the time, I’ve highlighted some of his key points with some new charts below for a quick read.
-
Dow/Gold Ratio Chart: Where are we in the Wealth Cycle?
Using the Dow Jones Industrial Average (Dow) as a measure of performance of the equities market in general, the ratio of the Dow to the price of gold indicates the performance of equities market relative to gold. Currently each point of the Dow is worth about 6oz of gold. During the process of correction after the biggest stock market bubble in history, the ratio is expected to head towards the historical mean (4oz) and overshoot it before finding its fair value again.
The bigger the bubble (deviation from mean), the larger the overshoot. During the present cycle, Mike expects the overshoot to touch 0.5:1 (1 oz of gold worth 2 points of Dow). In its extreme, the Dow would have to collapse from 11,000 to 950 if the price of gold remains at current level of $1,900. Conversely, gold will increase to $22,000 if the Dow remains at current levels.
Relative performance of Dow Vs Gold & Silver since Jan 2000
(Worst reference point, at peak of stock market bubble)
Relative performance of Dow Vs Gold & Silver since March 2009
(Best reference point, at the start of QE1)
Currency Supply Chart: Where are we in the Inflation/Deflation Cycle?
For simplicity, “money” & “currency” are used interchangeably here. Watch the video to see the difference.
Monetary inflation is the increase in money supply resulting in price inflation (rising prices of goods & services), with a time lag between the former and the latter. The reverse applies to monetary deflation and price deflation. Studying the trend in money supply or the total amount of currency in circulation (CinC) over a period of time gives us an idea of where we are and where we’re heading in terms of inflation and deflation.
Money is created in two stages. The initial Base Money is created by the Fed (or other central banks). More new money is then created (up to 9 times the initial Base Money) within the private banking system through credit. It is loaned into existence. Watch the video to learn more about the money creation process.
The chart above represents the amount of CinC that’s exclusively created by the private banking system. The highlighted area indicates that this component of the overall money supply has dropped by $1.7T since the 2008 crisis. This is the Debt Collapse or Credit Contraction. Less lending by banks results in less money chasing goods and services, leading to price & asset deflation. It is evident from the chart that a contraction of this magnitude has never happened since 1960. The last time it happened was just before the Great Depression of the 1930s.
 In response to this credit contraction, and in an attempt to prevent another Great Depression, the Fed has been rapidly increasing the Base Money supply by creating new money. The recent rate of increase is unprecedented. The first trillion dollars was created over a period of about 90 years. The next $1.4T came into existence over the last 2 years!
This rapid increase in Base Money (red chart) was an attempt to offset the decrease in the credit money (blue chart). When we add these two components of money supply together, we obtain the total CinC (Base Money plus Credit Money) as shown in the chart below.
Notice the contraction at the top of the chart, albeit a smaller one. It is evident that despite the frantic pace of money printing by the Fed, it has not succeeded in offsetting the reduction in money supply due to credit contraction.
The Fed has little choice but to continue creating money. With such a large perturbation in total currency supply and due to the complexity and size of the monetary system, it is not possible for the Fed or anyone else to create just sufficient money at just the right rate such that the total CinC won’t overshoot its long term trend. The principle that the larger the deviation from the mean, the larger will be the overshoot during the correction applies here as in the stock market above. The fact that there’s an undetermined time lag, between monetary inflation and price inflation further adds to the likelihood that the next round of money printing will result in a massive overshoot. Coupled with other factors, hyperinflation could be just round the corner.

In his book, Rich Dad’s Advisors: Guide to Investing In Gold and Silver: Protect Your Financial Future, and again in his presentation, Mike predicted the following sequence of events:-
- Threat of deflation - At the onset of the 2008 crisis (Past)
- Money printing - TARP, QE1, QE2 (Past & more to come)
- Big inflation - Here and now (anyone disagree?)
- Real deflation - Asset deflation in real estate & stock market (The severe but short deflation is ahead)
- Hyperinflation - Just round the corner?
How does gold perform under inflation and deflation environment? Check out the study by Oxford Economics: “Impact of inflation and deflation on the case for gold”.
Related Resources:
- Fractional Reserve Banking - Two short video clips on money creation
- Crash Course on Banking, Finance & Economy. By Chris Martenson
- Central Banking and the Federal Reserve System (Fed)


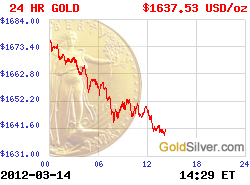
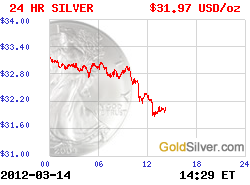
 More Charts: 1-Month, 1-Year, 5-Year, 10-Year
 More Charts: 1-Month, 1-Year, 5-Year, 10-Year

Even I’ve show them everything, including the profits I’ve made, they would probably say, “that’s cool, but it’s too expensive to buy now”….
Some ppl just dont geddit…
Well, you’re in luck! As I write this (3:50 PM EST) gold is off by about $75USD per ounce. Yeah! We’re all saved!!