Gold Vs. Miners: The Wrong Question, Part I
Submitted by Adrian Ash | BullionVault
-
Over the last 5 years, gold has turned every 1% gain in Gold Mining stocks into a 2% rise…
WHY are Gold Mining stocks underperforming the metal? asks Adrian Ash at BullionVault.
“Gold stocks should be a levered bet on the price of gold…There has been a terrible underperfomance,” as one forum posting said back in June.
“Thought this could be a good hedge against market meltdown but doesn’t follow gold price,” said another Gold Mining fund holder in August.
“Switched my portfolio to Blackrock Gold Acc in Feb. ’11 with the naive thinking it would give me a good exposure to Gold Prices,” said a third. “Gold has jumped 30% since then, but the fund is pretty much at the same price.
“I know there must be a lot of people in the same situation.”
Too true. February 2011 saw retail investors using UK brokerage TD Waterhouse choose Blackrock Gold & General as the top holding in their tax-protected ISA accounts for the third year running. And why not? Over the 12 years to this spring, as Blackrock’s own website says, its Gold & General Fund was the best-performing ISA product bar none. “Our investors,” said TD Waterhouse, “appear to be seeking some solidity in light of the continued Eurozone sovereign debt crisis and concerns over possible future inflation.”
Solidity paid off, but Gold Mining stocks didn’t. Over the next 6 months – and as the Eurozone debt crisis hit fresh peaks, and UK inflation held at 20-year highs above 5% year-on-year – gold put on 29% for Dollar investors and rose 27% for UK buyers. Gold equities, in contrast, lost 16% on the XAU index of US-listed producer stocks. Fighting the headwind of a falling Dollar, Blackrock’s Gold & General fund could only cut that loss in half for its UK investors.
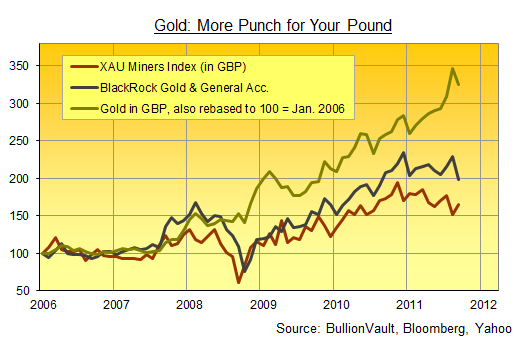
“We’re confident the gap will close,” said Evy Hambro, manager of the £3.3 billion mining-share fund ($5.2bn), to the Financial Times in September. “It has always closed in the past. This is an abnormally long one and an abnormally large one.”
But how long? And how abnormal exactly? No one’s expecting the answer which the data throw out.
“Gold shares historically outperform Gold Bullion in a rising market due to the operational gearing,” says another UK-run gold fund in its sales literature. That’s because, in a bull market for bullion, you’d expect Gold Mining firms to have “fixed or semi-fixed costs [but] rising revenue stream.” So you might even expect that famed 2-to-1 or 3-to-1 leverage over the gold price cited so often in mining-stock stories online.
But no. Here’s the percentage-point gap between Gold Bullion and nine different gold-equity plays, as of Sept. 30th this year…
| Year-to-Date | 1 year | 3 year | 5 year | 10 year | 15 year | |
| XAU Mining Index | -18 | -29 | +56 | -129 | -198 | -260 |
| HUI Index | -7 | -19 | +100 | -98 | +257 | -100 |
| Barrick (ABX) | -14 | -23 | +35 | -108 | -212 | -207 |
| Newmont (NEM) | +3 | -17 | +69 | -121 | -251 | -267 |
| US Global fund | -10 | -24 | +154 | -51 | +545 | +327 |
| Tocqueville fund | -18 | -27 | +195 | -62 | +403 | n/a |
| Van Eck fund | -15 | -26 | +163 | -55 | +474 | 0 |
| Blackrock fund* | -30 | -30 | -31 | -111 | +275 | +184 |
*Relative to gold in GBP Source: BullionVault via Bloomberg, Yahoo
Three things jump out, as you can see:
- First, not all Gold Mining stocks, indices or managed funds are the same, not by a country mile;
- The right miners (and the right funds) performed as expected if you bought them far enough back, outperforming gold bullion by a good margin since 1996 or 2001;
- Three years ago – October 2008 – was a one-time chance to pick up Gold Mining equity at such a wide discount, even shares in the biggest, lumbering producers have since beaten the investment return on plain gold bullion.
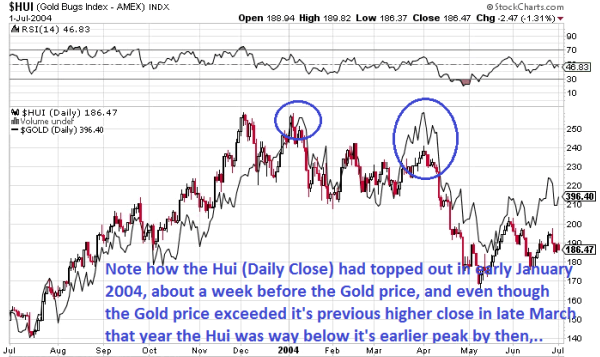
That opportunity to beat gold with stocks was very rare. Take the Philadelphia Stock Exchange’s XAU index of gold and silver miners, for instance. Its plunge amid the Lehman Brothers’ meltdown of 2008 made October that year the only month-end to offer the opportunity of out-performing gold bullion’s gains today since the XAU index was launched in 1983. Yes, really.
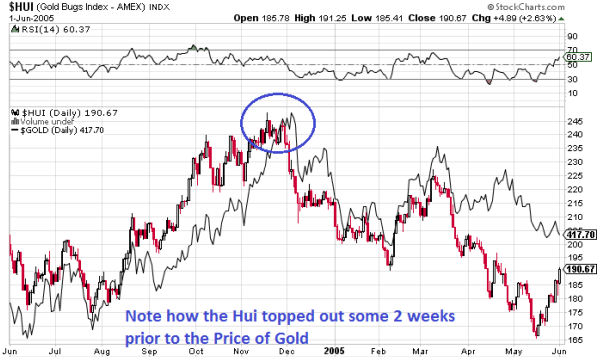
On the Amex Gold Bugs Index (the HUI), only 12 separate months in the last 120 have now seen new buyers out-pace gold bullion at today’s levels. For the UK’s actively-managed BlackRock Gold & General, it’s four months in the last nine years. For US Global Investors, 11 months in the last six years, and for the Tocqueville Gold Fund, it’s 20 months in the last eight years.
Underperformance in gold-mining equity is thus starting to look the norm, not the exception. Not only the producers as a group, but also the two biggest gold stocks (Barrick and Newmont) and even the top-performing managed funds are lagging it badly over 5 years, 1 year, and 2011 to date. Leverage to the Gold Price it ain’t.
Since Oct. 2006, in fact, every 1% move in the Gold Price has seen the Gold Mining producers add just 0.4% to their stock price on the HUI index. So far in 2011, they’ve turned every 1% gain into a 0.2% loss on the XAU.
The question, therefore, isn’t why the miners and funds are lagging gold. It’s why does gold keep beating the equity? Why has it reversed the expected leverage, turning every 1% rise in Gold Mining stocks into a better than 2% gain since 2006…? And might it be that this “abnormality” is in fact critical to the underlying bull market in bullion?
More to come in Part II. Meantime, are you ready to Buy Gold…?
Adrian Ash, 13 Oct ’11
 -
-
 -
-


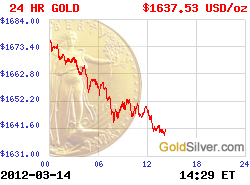
 More Charts: 1-Month, 1-Year, 5-Year, 10-Year
 More Charts: 1-Month, 1-Year, 5-Year, 10-Year
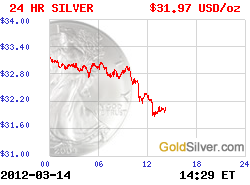

Recent Comments