A friend recently wrote “something about it does not sound right” after reading an article appearing in The Star entitled “Man’s addiction to gold” by Tan Sri Lin See-Yan. She asked for my comments, and I’m sharing them here.
-
Gold Standard
-
The author’s historical account of the evolution of gold’s role in monetary systems seems to slant in the direction that gold standard-based currencies have had their opportunity since distant past; They did not work and is unlikely to work in the future.
But why this obsession with gold? Some believe tying money to gold prevents its over-issue. That’s not true. Historically, declaring a gold parity for currency has certainly not prevented governments from over-issuing currencies and experiencing price inflation. Again, others believe gold provides the discipline governments need to maintain price stability. Certainly not.
History is full of instances where mercantilist excesses led to inflation at home and deflation overseas, and vice-versa. Yet, there are those who believe gold provides a sustainable form of settlement for international payments. Not true. Growth of international commerce requires flexible access to an adequate money supply to meet its needs gold does not meet this need in any stable way.
It is interesting to note that he wrote about the going in and coming off the gold standard (GS) as if it is the same standard, without differentiating the different forms of GS adopted in the past. In fact, the world had experimented with many forms of GS, with each form operating differently from the other. Broadly speaking, they were the Classical Gold Standard, Gold Bullion Standard and the Gold Exchange Standard. Understanding how and why nations moved in and out of GS and adopting various forms of GS is essential in understanding gold’s potential role in future monetary system. Currently, for the first time in recorded history, every nation is out of any form of GS, and this experiment is just over 40 years old.
-
For balance, I can point you to two resources that slant towards the advantages of a GS.
-
What has governments done to our money? by Murray N. Rothbard of the Ludwig von Mises Institute. Excellent read, but if you’d like to jump straight into the history of GS adoption, it’s in the The Monetary Breakdown of the West section beginning page 85.
-
The Unadulterated Gold Standard by Keith Weiner, Gold Standard Institute (starting page 3), discussing a new form of the future GS.
-
Now to the more down to earth aspects of gold.
-
Is gold a good store of value?
-
His answer in one word - NO. And the only justification cited was Warren Buffett’s quote.
Also, many believe gold serves as a good store of value. Again, no. Because it is sterile, it is not a good store of value compared with other assets. According to billionaire W. Buffett, US$100 invested in gold in 1965 is worth US$4,455 at the end of 2011; this same amount invested in S&P 500 stocks is worth US$6,072 after the same 46 years.
This is a very weak justification on two grounds.
- The period of investment was chosen arbitrarily
- The calculation is based on a method of investment that may not be practical
1. Choosing a period to compare relative performance of two asset classes.
To show that gold is not a good store of value, he cited Buffet’s calculation that uses two dates as a basis of comparing the relative performance of stocks (represented by the S&P500 index) and gold. The start date was 1965, end date was Dec 2011. During that period, it was calculated (more on the calculations later) that stocks out-performed gold, hence gold is not a good store of value.
-
This would be a valid argument if stocks and gold’s relative performance was fairly constant throughout history, in which case, picking any start & end dates would not matter. But this is not the case, and here’s why.
-
I’ve just uploaded a
Dow/Gold Ratio chart from 1900 to October 2012. The S&P/Gold Ratio chart would look similar, but I don’t have data going so far back and stretching all the way to the current date. This chart is plotted using the value (points) of the Dow Jones Industrial Index for each trading day since 1990 divided by the price of gold in US$ for that day. The ratio represents the number of ounces of gold required to buy one unit of the Dow.
-
Reproduced below with annotations, you’ll notice that stocks (represented by the Dow) and gold went through three distinct cycles (A, B & C) of over-performance and under-performance relative to one another. During each cycle, a rising ratio indicates that it takes more ounces of gold to buy one unit of the stock index; meaning stocks are outperforming gold, and vice-versa.
-
-
It is evident from this DGR chart that that picking a start and end date within the green segments of the three cycles would always show that gold is a “barbaric relic” while picking a period within the yellow segments would make gold shine. This chart clearly shows that both stocks and gold played their role as a good store of value at different times.
-
To substantiate his point that gold is not a good store of value, he relied on Buffet’s arbitrary starting point of 1965, ending 2011. Nothing wrong with this period, but why 46 years and not 2,000 years or 12 years? Because if it’s either one, his answer to the good store of value question would have to be a resounding YES. To run down gold as a sterile barbaric relic which is not a good store of value based only on an arbitrarily chosen period is misleading at best or simply mischievous.
-
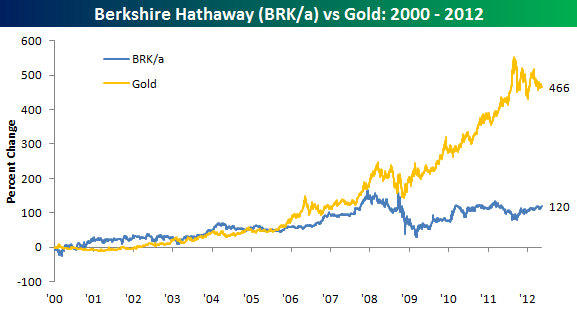
If Buffet or Tan Sri could pick an arbitrary period to make their point that gold is not a good store a value, let us do the same. If we pick the start date as Jan 2000, end date 2012, we get the two great looking 12-year charts below. The first is the percentage change in Buffet’s Berkshire Hathway stock price vs gold - that’s 12 straight years of under performance. To be fair, this chart excludes dividend yields, but it cannot possibly make up the huge gap. But I’m not going to conclude that Buffet’s Berkshire Hathway’s stock is not a good store of value. It’s just not as good as gold during this period.
-
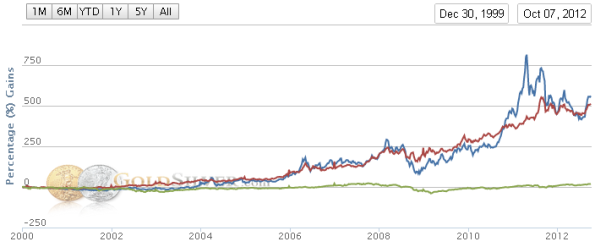
The second chart below compares gold & silver with the general stock market. Again, I would not put out a sweeping statement that stocks are not a good store of value. If I had chosen the starting date to be Jan 1980, it will look very different. I just wished the “stock bugs” would handle data with similar respect.
-
 -
-Gold & silver versus Dow from Jan 2000 to Oct 2012
(Red=Gold, Blue=Silver, Green=Dow)
-
My point here is not to run down stocks, but just to rebut “stock bugs” who run down gold bugs irresponsibly. Clearly both asset classes have their place in history as stores of value. Question is , under the current economic, monetary and geo-political climate, which asset class will do a better job at wealth preservation going forward.
-
-
Lets look closer at the DGR chart. Notice that with each successive cycle, the peaks get higher and when they correct, the troughs also get lower. This phenomenon is known as an overshoot; It happens in
nature and is
applicable in financial models as well.
-
Many analysts predict the ratio will approach, or even plunge below 1.0. For the ratio to reach 1:1 at current prices, the Dow would have to move down from 13,346 to match gold at 1,726 or gold moves up from $1,726 to meet the Dow at $13,346. With the QE to Infinity policy currently in place, more likely than not, both would move up, with gold rising at a faster rate; Or they may meet anywhere in between to establish a 1:1 ratio.
-
A casual glance at the Dow/Gold Ratio chart above may give the impression that at this point (DGR=7.7), new entrants to gold may have missed the boat considering that it has already moved so far down from its peak. However, in percentage terms, that’s only about 600% from the peak, while the rest of the journey, if we reach 1.0, would be close to another 700% from current levels.
-
2. The calculation is based on a method of investment that may not be practical
-
Now, assuming the picking of an arbitrary period is a non issue, an average investor is unlikely to achieve the kind of returns cited. Going back to the billionaire’s calculation:
US$100 invested in gold in 1965 is worth US$4,455 at the end of 2011; this same amount invested in S&P 500 stocks is worth US$6,072 after the same 46 years
Let’s use his figures and convert them to percentage gains.
Percentage gain on $100 invested in stocks = ((6071-100)/100)x100% = 6,071%
Percentage gain on $100 invested in gold = ((4455-100)/100)x100% = 4,355%
-
Now, if you calculate the percentage gain of the S&P from Jan 1965 (85.37) to Dec 2011 (1,265), you’ll come up with a gain of 1,382% , nothing close to the 5,972% gains cited above. That’s because you’ve just calculated the capital gains of the S&P index over that period. In other words, the increase in the value of your investment based on the increase of your stock price.
-
-
Gold, on the other hand is straight forward. Gold’s gain from Jan 1965 ($35.50) to Dec 2011 ($1,603), was a clean 4,415% (close to his calculated 4,355%) capital gain. This is despite the fact that in Dec 2011, gold was at its lowest during the current correction. Hence, if the dividends were not reinvested in full and immediately, gold would have outperformed stocks based on capital gains alone.
-
Gold Bug & Gold Investment Schemes
-
The recent
raid by Bank Negara on Genneva Malaysia Sdn Bhd and three other companies have cast a bad light on things related to gold. The public tend to associate gold ownership with buying into one of these scams. When news of the raids broke out, I have well meaning friends asking me if I was affected! Thanks, but I would not touch these with a 10-foot pole. I totally agree with the author’s advise on this point:
My advice: avoid investing in any of them at all cost!
There are however, many genuine options to own gold safely and cost-effectively for Malaysians (unlike the 30% premium charged by Genneva) . Check out
Buying & Storage Options for more details.
-
The other thing I’m on the author’s side is that I don’t consider myself a gold bug. I am using gold (& silver) as a store of value until such time when it’s prudent to exit gold (& silver). Check out when you may have to start converting your gold into another asset class which may be a better store of value in the future. When to
exit gold?
-
Related Resources:
-
Like this:
Be the first to like this.
 by gold priced in Dollars")

 To achieve a gain of 6,071% you’ll have to factor in dividend yields, assuming that every dollar distributed is reinvested immediately. This is referred to as the Total Returns calculation. In practice, it’s not so straight forward to achieve. That’s because there are issues like timing, tax, brokers’ fees, etc to consider. See Limitations of Total Return as a Measure for Fund, Bond and Stock Performance. I doubt an average investor would be able to achieve the total returns cited in his calculations.


 Gold & Silver Interviews (KWN)